Quantcast
Channel: Resources for oil analysis
Viewing all 154 articles
Browse latest View live

The Benefits of Route-Based Oil Analysis

$
0
0

Personnel who carry out machinery health inspections at industrial plants today generally follow pre-defined inspection routes. This “walking-the-beat” approach has proven to be effective for analysis of vibration and infrared thermography because the information derived from on-the-spot, real-time inspections and data collection is extremely useful. These inspections are also economical in many situations where having permanently installed equipment on each asset would be too costly.

Until now, these pre-defined machinery health inspections have not included route-based oil analysis in order to determine lubricant properties quantitatively. It just was not possible previously to perform this type of analysis at each point along the route within a minute (or two at the most). Now, with the development of certain handheld tools such as the FluidScan Q1100, it is feasible to obtain critical, quantitative oil parameters within a short time right at the sampling point (see Figure 1). As a result, it is possible to envision a route-based oil analysis protocol.

Route-based oil analysis is a big step beyond visual inspections by maintenance personnel as they go through a plant along a pre-determined route to perform greasing or topping-off of lubrication systems.


Figure 1. Route-based oil sampling

Of course, technicians should still observe the machinery visually while walking a route, but on-the-spot oil analysis can be done very quickly with good accuracy and with repeatable results. Walk-around analysis provides immediate feedback and the ability to retest right in the field if needed. In many cases, it is not even necessary to use a sample bottle. Route-based oil analysis adds even greater value because the information provided from a structured database is always correct and consistent. No time is wasted, and no human error is incurred, since the route automatically associates reference information with each designated sample point.

By consistently identifying the correct reference oil and asset sample point with a test, the walk-around infrared spectrometer operator can achieve far better repeatability and accuracy than can typically be achieved in a commercial laboratory. Many commercial labs do not have the ability to consistently identify the exact lubricant and other pertinent information related to each test sample. That information is generally not available in the practice of their business.


Figure 2. Visual observations collected
and assigned to samples on a route

Today’s portable instruments used for route-based oil analysis are able to outperform lab instruments because the information available at the point of the test identifies the appropriate test methods, analysis parameters and alarm limits for each lubricant sample on a sequential route. Simply stated, route-based oil analysis allows technicians to do a better job of oil analysis and get it done quickly because their instruments are programmed to always select the correct protocol and reference information for each point along the route.

Six elements must normally be addressed for a technician to conduct a route-based analysis with a portable analyzer in an industrial plant or around a fleet of mobile equipment:

  • Create a structured database.
  • Populate the database with route information associated with the oil and equipment in the database.
  • Select a preferred inspection route.
  • Transfer route information into a handheld analyzer.
  • Apply route information in the analyzer during in-field analysis.
  • Upload measurements and findings to the database.

Database Creation

A maintenance server is configured to generate oil analysis routes based on a set of analysis rules (see Figure 3). These rules may be based on time, a previously existing condition or specified by the maintenance engineer. The route could include the sequence, asset identification and/or reference oil information, such as oil name, type, property limits, etc.


Figure 3. Creating a route using a structured database

Populating the Database

The generated route is synched between the maintenance server and the device to be used for the route-based analysis. This can be accomplished in a number of ways, including a straight database synch, a file download/transfer or a barcode list, which could serve the dual purpose of a sample bottle label. For a set of recurring routes, a binder could be constructed of 8½-by-11-inch sheets of paper that could be pulled out and scanned whenever a given route is indicated (see Figure 4).


Figure 4. A “route” of points represented by
sequenced machine-readable sample labels

Sample labels afford the benefit of potentially including other data independently collected from the lab or other onsite test instruments into this same sample record. Still another way to accomplish this would be for the user to print and laminate labels and attach them to each sample point. Then, when the technician walks the route, he or she could scan the barcode to add that location to the route in the database.

Route Analysis

With the route information downloaded into the handheld machine, lubricants are analyzed at each asset in sequence. The handheld unit operates in a self-guiding fashion so that the user is presented with the next asset’s information when finished with the analysis of each asset. This may include GPS coordinates of the asset, a picture, serial number or simple instructions on where to find the next asset. The handheld device contains all the calculation tools necessary to perform the analysis.

The results of each lubricant scan are stored in the handheld unit. The technician can see the results as soon as they are produced. This can include alarm limits imported from the maintenance server so that the user can determine immediately if the machine is “in spec” according to the analysis. If the machine is “out of spec,” additional instructions may be offered, such as collect an oil sample at that machine for further analysis.

Transferring Data

When the route is complete, the handheld device is again synched with the maintenance server so the data can be uploaded and the database updated. The maintenance engineer can then review this data and use the server’s analytical tools to determine if any further action is needed.

Planning a System

It is easy to envision how a route-based oil analysis system could be a valuable tool for a large facility where route-based machinery health monitoring is practiced. With the natural flow of data in a route-based system, decision-makers can see how on-the-spot oil analysis could fit into the context of their other asset-management tools. It certainly provides a convenient and practical way to perform oil analysis with minimum or no paperwork. Furthermore, as at-line, in-line and on-line tools are developed for oil analysis as they have been for vibration monitoring, a similar path is envisioned for these two probes of machinery health.

By using route-based oil analysis, users can plan coverage for a whole range of assets based on economic considerations. Dedicated in-line and on-line analyzers that have the same capabilities as the handheld at-line tools may be used where appropriate, with that data stream tied together with the route-based system at the maintenance server and overall system.

It is clear that oil analysis and other probes of machinery health, such as vibration and thermography, have fundamental differences that must be considered when planning how and when to use emerging oil analysis tools. Oil analysis, which is inherently a physical and chemical investigation of the oil including its base, additives, contaminants and wear debris, is significantly different than vibration monitoring or thermography, both of which use information arising directly from the machinery.

When the lubricant within that machinery is analyzed for chemical information, users have another means of assessing the health of the machine, the type and extent of system contamination, and the functional condition of the oil. This extra step needed for oil analysis helps to explain why oil analysis instrumentation is still emerging for on-the-spot, full and quantitative machinery assessment. Nevertheless, significant recent advances in the speed, size and weight of quantitative oil analysis tools indicate a route-based oil analysis paradigm can now be a reality.


Savant Group to Expand Michigan Facility

$
0
0

The Savant Group recently announced a $3-million investment to expand its manufacturing, laboratory and training capabilities at its headquarters in Midland, Mich., serving the automotive, petroleum and chemical industries.

The state-of-the-art addition will support a technical training facility for distributors and customers, an expanded customer service area, and additional laboratories and manufacturing space. The manufacturing area will focus on the production of precision bench-top instruments for characterizing and understanding the properties and behavior of automotive fluids and industrial lubricants. The new laboratories will support additional testing services and technical development activities. The building expansion is expected to be completed in the spring of 2014.

Comprised of four individual companies — Savant Labs, Tannas Co., King Refrigeration Inc. and the Institute of Materials (IOM) — the Savant Group provides service and expertise to help customers evaluate the performance of new blends of oils, lubricants, fuels and related products to meet industry and OEM specifications, quality-control monitoring, and the development of new test methods.  

"Our in-depth approach to testing and understanding of lubricant applications has helped solve critical industry problems, and this investment demonstrates our commitment to be an active, eager partner with researchers, producers and OEMs in the industries we serve," said Ted Selby, Savant Group founder and vice president of technical development.   

For more information, visit www.savantlab.com.

6 Ways to Maximize Your Oil Analysis Software Value

$
0
0

Organizations have used oil analysis for decades to identify lubrication problems that could require equipment repair or even shut down an entire line of heavy machinery. Although the technique for sample collection remains predominantly unchanged, technology has revolutionized the information available once the sample is analyzed. Improved technology, however, can mean a sea of data, which may be overwhelming to even the most business-savvy customer. There are many oil analysis software programs that promise to process complicated data, interpret results and offer recommendations. Additionally, beyond traditional sample analysis, software programs now offer systems for managing maintenance schedules, advanced data graphing and data-mining applications.

Not surprisingly, today’s plant engineers and fleet managers have several options when selecting software to manage their oil analysis needs. Choosing the proper software and maximizing its features can provide a huge payback for the user through reduced machinery maintenance expenses.

For more than 50 years, oil analysis has been used to help diagnose the internal condition of oil-wetted components. Original testing methods focused on visual inspection coupled with a simple smell test. First used in the railroad industry in 1946, laboratory analysts detected problems in diesel engines through evaluation of metals in used oils. By 1955, the United States Naval Bureau of Weapons had adopted oil analysis procedures to predict aircraft component failure.

Testing and evaluation practices have evolved dramatically over the last five decades, making oil analysis one of the most effective predictive maintenance technologies available. Monumental changes have taken place within the laboratory in the areas of sample evaluation and more importantly in how the data is reported and managed.

As recently as 10 years ago, customers collected an oil sample, hand-wrote information on a label and mailed the sample to the laboratory via traditional mail services. Two or three weeks later, the customer would receive a hard copy of the laboratory report in the mail. Today, improved instrumentation, streamlined delivery services and enhanced technology put comprehensive results in a customer’s hand within 24 hours. This shortened result cycle is essential in the identification of critical samples and can prevent expensive equipment repairs and costly downtime.

Additional benefits of a properly executed oil analysis program include reduced lubricant costs, decreased energy consumption, enhanced equipment efficacy, improved production, and reduced risk of injury and environmental damage.

Technology Enhancements

As research and technology have advanced over the years, progress in lubricant testing has kept pace. The following are some of the key areas of technology enhancement in the oil analysis industry:

Information Delivery

Once limited to a single hard copy of a distinct sample, customers can now review results online, download reports and share them with colleagues. The delivery cycle has also been condensed from several weeks to within 24 hours.


Online labeling offers the ability to print pre-registered
sample labels for quick and proper processing.

“I can do oil analysis 24 hours a day, seven days a week, 365 days a year,” says industry expert and consultant John Underwood. “I used to have to wait for weeks for the paper to show up in the mail two weeks after I submitted the sample.”

Sample Identification

Within the last decade, technology has allowed field technicians to use the Internet to input comprehensive data about each oil sample. This improvement has reduced the risk of incorrect information gleaned from hand-written forms as well as increased the amount of information technicians can provide to laboratories about each sample.

Enhanced Functionality

Current oil analysis software programs offer improved reporting capabilities that extend far beyond the examination of a single sample. In addition to maintenance program management tools, software developments have enabled cross-comparison of makes, models and lubricant types within the asset population. Maintenance administrators can manage equipment information online and provide it to laboratory experts, which in turn enables data-mining capabilities that can identify critical trends. Graphing tools can also give a visual representation of the results.

Selecting an Oil Analysis Software Program

Choosing a laboratory and technology partner for your predictive maintenance program is not a decision to be taken lightly. Rather, it is important for this strategic evaluation to consider several essential factors:

Third-Party Status

By selecting an independent lab, customers are assured non-biased information from an organization that encourages total access and utilization of all the data and management tools available. Brand-specific laboratories may be experts on their own products, but they may not be trained on a variety of equipment or lubricants. While independent sources are always fee-based, these organizations offer the most state-of-the-art technology and services available. The bottom line is that it’s your data, and you should have access to as much information as possible.

Professionals Behind the Software

While technology is ever evolving, the importance of expert human involvement cannot be overstated. Search for a lab with depth of knowledge and experience as well as important industry credentials.

Ability to Proactively Manage Equipment

Look for a system that allows you to proactively manage equipment records, including location, name or identification, make, model and lubricant information.

User Administration Tools

Not every member of a team needs access to every piece of information. The best software programs allow maximum flexibility, enabling mangers to self-administer and control customized permissions. Choose a system that lets administrators add and delete users, establish and manage groups of users, and grant individualized access permissions. Other beneficial tools include customizable views and layouts, which put the most useful and important information right where you need it when you need it most.

Varied Data-Mining Capabilities

One of the most recent and helpful technological developments is customized graphing and result capability. Gone are the days of pouring over spreadsheets searching for tendencies and clues. Trend graphs utilize user-defined criteria to provide a visual representation of general wear, contamination and other common problems. Comparison graphing allows users to compare specific pieces of equipment against like machines or an entire population of equipment. Providing complicated information in an easy-to-understand format, these reports deliver useful information for maintenance and purchasing decisions.


Dashboards provide users with easy-to-understand graphs
regarding sampling program performance.

6 Tips for Getting the Most from Your Oil Analysis Software

The return on your oil analysis program depends greatly on what you put into it. Industry research indicates that most maintenance programs achieve only 10 percent of the benefits available from oil analysis. User adoption of a more technological marketplace has been slow, and many fear information overload. However, by employing a few key strategies, you can maximize your oil analysis software for maximum results.

Conduct Training

At its most basic level, training can consist of the proper technique for sampling. Even with just simple computer skills, users can learn to navigate software programs and take full advantage of their services and benefits.

“Training is critical to helping users understand what the programs can do to make their jobs easier and more effective,” Underwood says.

Many programs provide training via workshops, online videos, webinars, onsite training, newsletters or downloadable PDFs. Encourage your team to utilize these educational modalities. As users become comfortable with the basics, they can add to their learning based on their role or the company’s needs. For example, lubrication technicians can learn more about sampling techniques and data input, while engineers can explore more technical graphing tools. If the software program offers ongoing customer service, don’t hesitate to contact the hotline for product-specific guidance.

Utilize Program Management Tools

Customizable features make managing an oil analysis program easier and more effective than ever. Beyond tracking and storing results, modern systems help users record maintenance events such as sampling dates, usage hours and time in service. You can also create customized alarms to routinely collect samples on a prescribed basis. Whether your maintenance practices require collection every 500 hours or every quarter, these predictive samplings can prevent condition-based situations that may signal imminent failure. Also, look for scalable programs that adjust to your individual needs.

Ensure Information is Complete

The adage “garbage in, garbage out” never rang more true than when collecting a lubricant sample.

“Technology cannot make up for a bad sample,” Underwood warns.

Incomplete or illegible information can lead to data-entry errors and limited testing that yields suboptimal reporting. Once restricted to whatever information could be scribbled on a small label, the latest software programs allow maintenance technicians to input critical information, including equipment (make, model, identification number, location, etc.), hours of operation, maintenance activities, drain interval and more.


Equipment management functions enable users to fully register
critical information about each piece of equipment.

While incomplete information doesn’t affect the test results, it significantly impacts the analyst’s ability to draw conclusions or detect trends. Therefore, it is essential that users provide repetitive, information-rich and credible samples to ensure quality and meaningful reports. When more data points are given during the sampling process, laboratory analysts can deliver more comprehensive reports. With consistent and complete sample information, labs can ensure normalization of results based on the organization’s result history.

Take Advantage of Data Mining

A highly technical area of computer science, data mining extracts information from a set of data and transforms it into understandable and actionable information. In oil analysis, this process uses data management and complex metrics to detect abnormalities in single samples or groups of samples.

While laboratory experts excel in extracting comprehensive information from a sample, end users may find it difficult to put technical information into practical terms. The average manager typically isn’t interested in particle counts or the presence of iron or metals in a single piece of equipment. However, the ability to recognize trends across a population of equipment can signal a bigger problem that could result in lost revenue from downtime or expensive repairs.

According to Underwood, data mining is particularly helpful when managing fleets.

“The ability to compare units and equivalent services helps companies determine what the best product on the market is for their particular business,” he says.

It is important to note that data mining is not the end user’s responsibility but rather an important and integrated component of any effective software program.

Use Graphical Comparisons

Graphs and other visual representations highlight the severity of non-conforming data far better than tables and spreadsheets. Keep in mind that if a report isn’t readable, it won’t get read.


Comparison graphing offers a visual comparison of equipment performance
against a population of data, allowing plant personnel to determine
which makes and models are best suited for each site.

“A picture is worth a thousand words,” Underwood says. “People understand a graphical data presentation much more readily than a bunch of numbers, so it is a critical component to any software program.”

Users should be able to select different graphing styles (line, bar, area, spider, etc.) based on preference and need. Especially helpful in comparing a pre-defined set of parameters, graphs can use data normalization to identify wear rates and predict equipment failures. Beyond looking at a single piece of equipment or sample, graphs can provide a cross-comparison that allows users to compare units regardless of make, model or other specifications.


Graphing sample conditions enables users to easily spot
trends in specific units, equipment types, makes or models.

Graphs also present a visual picture of a single piece of equipment when compared to the entire population of machinery. While graphing tools should be easy to use, getting the most out of this new technology may require additional training.

Collaborate and Communicate

Managing a plant or fleet and its maintenance program is a collaborative effort requiring a team of technicians, engineers, administrators and manufacturers. Communication between team members, especially in a critical situation, is vital. Today’s software programs allow administrators to authorize which users can view information, manage equipment and more. It’s even possible to share information with equipment and lubricant manufacturers, leveraging all available resources for maximum results. By establishing alerts, messaging, preferences and access for all essential team members, administrators can create a highly specialized network of shared information.

Maximizing Your Maintenance Budget

In this extremely competitive era of reduced profit margins, companies are forced to squeeze the most out of their maintenance budgets. People, equipment and systems are expected to do more with fewer resources. Information technology is necessary for any organization’s preventative maintenance program. With increased access to information, oil analysis software companies are helping maintenance managers spot trends, compare equipment and identify dangerous problems before they happen. Yet only 10 percent of users maximize their software programs. Ongoing training will help managers and administrators make the most of the ever-changing tools available.

Through the use of program management tools, proper sample registration, data-mining tools, graphical interpretations and data sharing, organizations can ensure the longevity of their equipment and a more robust bottom line. Technology will continue to advance, providing additional tools to the analysts, manufacturers, service providers and end users. How effectively that technology is leveraged will determine the ultimate success of the company.

About the Author

Cary Forgeron is the national field service manager for Analysts Inc. He has more than 10 years of experience in developing oil sampling programs for end users to meet their organization’s maintenance and reliability goals. Contact Cary at cforgeron@analystsinc.com.

.

EPA Confirms Alternative Method for Measuring Crude Oil Vapor Pressure

$
0
0

At the request of the American Petroleum Institute (API), the U.S. Environmental Protection Agency (EPA) recently confirmed the use of the ASTM D6377-10 standard as an alternative test method for the determination of the true vapor pressure (TVP) of crude oils.

As defined by the International Maritime Organization, the true vapor pressure or bubble point vapor pressure is the equilibrium vapor pressure of a mixture when the vapor/liquid ratio (V/L) is zero. This ratio can be achieved if a container is filled to the top with crude oil.

A correct interpretation of the TVP term always depends on the specification for which it is used. In refining, the term TVP often is used to reflect the specific conditions of storage or transport. For example, if a truck or ship is filled 95 percent with crude oil and only 5 percent of vapor space remains, the vapor/liquid ratio of 0.053 may be referred to as TVP.

The ASTM D6377 method allows measurement of TVP at various vapor/liquid ratios to indicate different tank filling levels. Widely used by the oil and gas industry, the new method is now included within the Ametek Grabner Instruments vapor pressure testers provided by Petrolab Company.

For more information, visit www.grabner-instruments.com

Anatomy of an Oil Analysis Report

$
0
0

This is the fifth part of a series of “anatomy” lessons within Machinery Lubrication. In this issue, a specific device or object will not be dissected but rather the content provided in a typical oil analysis report, including how to interpret the data and other findings. These interpretations may decide either the cost or avoidance of machine failure and downtime.

Interpreting an oil analysis report can be overwhelming to the untrained eye. Oil analysis isn’t cheap, and neither is the equipment on which it reveals information. Every year, industrial plants pay millions of dollars for commercial laboratories to perform analysis on used and new oil samples. Unfortunately, a majority of the plant personnel who receive these lab reports do not understand the basics of how to interpret them.

What to Look for When Reviewing an Oil Analysis Report

  1. Read and check the data on the oil type and machine type for accuracy.
  2. Verify that reference data is shown for new oil conditions and that trend data is at an understood frequency (preferably consistent).
  3. Check the measured viscosity.
  4. Verify elemental wear data and compare to reference and trended data. Use a wear debris atlas to match elements to their possible source.
  5. Check the elemental additive data and compare to reference and trended data. Use a wear debris atlas to match elements to their possible source.
  6. Verify elemental contamination data along with particle counts and compare with reference and trended data. Use a wear debris atlas to match elements to their possible source.
  7. Check moisture/water levels and compare to reference and trended data.
  8. Verify the acid number and base number and compare to reference and trended data.
  9. Check other analyzed data such as FTIR oxidation levels, flash point, demulsibility, analytical ferrography, etc.
  10. Compare any groups of data that are trending toward unacceptable levels and make justifications based on these trends.
  11. Compare written results and recommendations with known information on the oil and machine, such as recent changes in environmental or operational conditions or recent oil changes/filtration.
  12. Review alarm limits and make adjustments based on the new information.

Typically, an oil analysis report comes with a written summary section that attempts to put the results and recommendations in layman’s terms. However, since the laboratory has never seen the machine or know its full history, these recommended actions are mostly generic and not precisely tailored to your individual circumstances. Therefore, it is the responsibility of the plant personnel who receive the lab report to take the proper action based on all known facts about the machine, the environment and recent lubrication tasks performed.

Why Perform Oil Analysis

An obvious reason to perform oil analysis is to understand the condition of the oil, but it is also intended to help bring to light the condition of the machine from which the oil sample was taken. There are three main categories of oil analysis: fluid properties, contamination and wear debris.

Fluid Properties

This type of oil analysis focuses on identifying the oil’s current physical and chemical state as well as on defining its remaining useful life (RUL). It is designed to answer questions such as:

  • Does the sample match the specified oil identification?
  • Is it the correct oil to use?
  • Are the right additives active?
  • Have additives been depleted?
  • Has the viscosity shifted from the expected viscosity? If so, why?
  • What is the oil’s RUL?

Contamination

By detecting the presence of destructive contaminants and narrowing down their probable sources (internal or external), oil analysis can help answer questions such as:

  • Is the oil clean?
  • What types of contaminants are in the oil?
  • Where are contaminants originating?
  • Are there signs of other types of lubricants?
  • Is there any indication of internal leakage?

Wear Debris

This form of oil analysis is about determining the presence and identification of particles produced as a result of mechanical wear, corrosion or other machine surface degradation. It answers a number of questions relating to wear, including:

  • Is the machine degrading abnormally?
  • Is wear debris produced?
  • From which internal component is the wear likely originating?
  • What is the wear mode and cause?
  • How severe is the wear condition?

Ultimately, you need to know if any actions should be taken to keep the machine healthy and to extend the life of the oil. Oil analysis for machines can be compared to blood analysis for the human body. When a doctor pulls a blood sample, he puts it through a lineup of analysis machines, carefully studies the results and reports his conclusions based on his education, research and detailed questions asked to the patient. Likewise, with oil analysis, careful oil samples are taken, and elaborate machines yield the test results. Laboratory personnel interpret the data to the best of their ability, but without crucial details about the machine, a diagnosis or prognosis can potentially be inaccurate. Some of these important details include:

  • The machine’s environmental conditions (extreme temperatures, high humidity, high vibration, etc.)
  • The originating component (steam turbine, pump, etc.), make, model and oil type currently in use
  • The permanent component ID and exact sample port location
  • Proper sampling procedures to confirm a consistently representative sample
  • Occurrences of oil changes or makeup oil added, as well as the quantity of makeup oil since the last oil change
  • Whether filter carts have been in use between oil samples
  • Total operating time on the sampled component since it was purchased or overhauled
  • Total runtime on the oil since the last change
  • Any other unusual or noteworthy activity involving the machine that could influence changes to the lubricant

Oil Analysis Tests

For a standard piece of equipment undergoing the normal recommended oil analysis, the test slate would consist of “routine” tests. Alternatively, if additional testing is needed to answer advanced questions, these would be considered “exception” tests. Routine tests vary based on the originating component and environmental conditions but should almost always include tests for viscosity, elemental (spectrometric) analysis, moisture levels, particle counts, Fourier transform infrared (FTIR) spectroscopy and acid number. Other tests that are based on the originating equipment include analytical ferrography, ferrous density, demulsibility and base number testing.

The table on the left shows how tests are utilized in each of the three main oil analysis categories.

Viscosity

Several methods are used to measure viscosity, which is reported in terms of kinematic or absolute viscosity. While most industrial lubricants classify viscosity in terms of ISO standardized viscosity grades (ISO 3448), this does not imply that all lubricants with an ISO VG 320, for example, are exactly 320 centistokes (cSt). According to the ISO standard, each lubricant is considered to be a particular viscosity grade as long as it falls within 10 percent of the viscosity midpoint (typically that of the ISO VG number).

32% of lubrication professionals would not understand how to interpret an oil analysis report from a commercial laboratory, based on a recent poll at MachineryLubrication.com

Viscosity is a lubricant’s most important characteristic. Monitoring the oil’s viscosity is critical because any changes can lead to a host of other problems, such as oxidation, glycol ingression or thermal stressors.

Too high or too low viscosity readings may be due to the presence of an incorrect lubricant, mechanical shearing of the oil and/or the viscosity index improver, oil oxidation, antifreeze contamination, or an influence from fuel, refrigerant or solvent contamination.

Limits for changes in the viscosity depend on the type of lubricant being analyzed but most often have a marginal limit of approximately 10 percent and a critical limit of approximately 20 percent higher or lower than the intended viscosity.

Acid Number/Base Number

Acid number and base number tests are similar but are used to interpret different lubricant and contaminant-related questions. In an oil analysis test, the acid number is the concentration of acid in the oil, while the base number is the reserve of alkalinity in the oil. Results are expressed in terms of the volume of potassium hydroxide in milligrams required to neutralize the acids in one gram of oil. Acid number testing is primarily performed on non-crankcase oils, while base number testing is mainly for over-based crankcase oils.

An acid number that is too high or too low may be the result of oil oxidation, the presence of an incorrect lubricant or additive depletion. A base number that is too low can indicate high engine blow-by conditions (fuel, soot, etc.), the presence of an incorrect lubricant, internal leakage contamination (glycol) or oil oxidation from extended oil drain intervals and/or extreme heat.

FTIR

FTIR is a quick and sophisticated method for determining several oil parameters including contamination from fuel, water, glycol and soot; oil degradation products like oxides, nitrates and sulfates; as well as the presence of additives such as zinc dialkyldithiophosphate (ZDDP) and phenols. The FTIR instrument recognizes each of these characteristics by monitoring the shift in infrared absorbance at specific or a range of wavenumbers. Many of the observed parameters may not be conclusive, so often these results are coupled with other tests and used more as supporting evidence. Parameters identified by shifts in specific wavenumbers are shown in the table below.

Elemental Analysis

Elemental analysis works on the principles of atomic emission spectroscopy (AES), which is sometimes called wear metal analysis. This technology is designed to detect the concentration of wear metals, contaminants or additive elements within the oil. The two most common types of atomic emission spectroscopy are rotating disc electrode (RDE) and inductively coupled plasma (ICP). Both of these methods have limitations in analyzing particle sizes, with RDE limited to particles less than 8 to 10 microns and ICP limited to particles less than 3 microns. Nevertheless, they are useful for providing trend data. Possible sources of many common elements are shown in the table below.

The best way to monitor this type of data is to first determine what is expected to be in the oil. An effective oil analysis report will provide reference data for the new oil so any amounts of additive elements can be easily distinguished from those of contaminants. Also, because many types of elements should be expected at some level (even contaminants in certain environments), it is better to analyze trends rather than focus on any specific measurement of elemental analysis data.

Particle Counting

Particle counting measures the size and quantity of particles in the oil. Many techniques can be used to assess this data, which is typically reported based on ISO 4406:99. This standard designates three numbers separated by a forward slash providing a range number that correlates to the particle counts of particles greater than 4, 6 and 14 microns. To view an illustration of how different particle counts are assigned specific ISO codes, visit http://www.machinerylubrication.com/Read/29525/sample-new-oil.

Moisture Analysis

Moisture content within an oil sample is commonly measured with the Karl Fischer titration test. This test reports results in parts per million (ppm), although data is often shown in percentages. It can find water in all three forms: dissolved, emulsified and free. The crackle test and hot-plate test are non-instrument moisture tests for screening before the Karl Fischer method is used. Possible reasons for a moisture reading being too high or too low would include water ingression from open hatches or breathers, internal condensation during temperature swings or seal leaks.

Interpreting Oil Analysis Reports

The first thing to check on an oil analysis report is the information about the customer, originating piece of equipment and lubricant (see Section A of the sample report on page 49). Including these details is the customer’s responsibility. Without this information, the effectiveness of the report will be diminished. Knowing which piece of equipment the oil was sampled from affects the ability to identify potential sources of the measured parameters, especially wear particles. For example, the originating piece of equipment can help associate reported wear particles with certain internal components. The lubricant information can provide a baseline for several parameters, such as the expected viscosity grade, active additives and acid/base number levels. These details may seem straightforward but are often forgotten or illegible on the oil sample identification label or request form.


ref. Fluid Life

The next section (Section B) of the oil analysis report to examine is the elemental analysis or FTIR breakdown. This data can help identify contamination, wear metals and additives present within the oil. These parameters are reported in parts per million (ppm). Nevertheless, this does not mean a contamination particle, for example, can only be indicated by sodium, potassium or silicon spikes. In the example above, the rise in silicon and aluminum could potentially indicate dust/dirt contamination as the root cause. One likely explanation for these spikes is that as dirt (silicon) enters the oil from an external source, three-body abrasion occurs within the machine, causing wear debris including aluminum, iron and nickel to increase.

With a better understanding of the metallurgy within the system’s components, any spikes in wear metals can be better associated, allowing a proper conclusion as to which internal components are experiencing wear. Keep in mind that for trend analysis, it is important that samples are taken at an appropriate and uninterrupted frequency.


Graphs in an oil analysis report can help illustrate notable trends in the data. (Ref. Fluid Life)

With elemental data related to contaminants and wear metals, alarms are set for upward trends in the data. For elemental data pertaining to additives, alarms are set for downward trends. Having a baseline of new lubricant reference data is critical in assessing which additives are expected and at what levels. These baselines are then established to help determine any significant reduction in specific additives.

Another section of the oil analysis report presents previously identified sample information from the customer such as oil manufacturer, brand, viscosity grade and in-service time, as well as if an oil change has been performed. This is important data that can provide an explanation for what could be false positives in alarming data changes.

The “physical tests” section of a report offers details on viscosity at both 40 degrees C and 100 degrees C, along with the viscosity index and percentage of water. For common industrial oils, the viscosity measurement at 40 degrees C is usually given, since this correlates to the oil’s ISO viscosity grade. If the viscosity index must also be calculated, such as for engine oil, then these additional viscosity measurements will be identified. The viscosity for engine crankcase oils is typically reported at 100 degrees C.

Water contamination, which commonly is measured by the Karl Fischer test, is presented in percentages or ppm. While some systems are expected to have high levels of water (more than 10,000 ppm or 10 percent), the typical alarm limits for most equipment are between 50 to 300 ppm.

The “additional tests” section shows two final tests: acid number (AN) and particle size distribution (aka, particle count). When analyzing the acid number, you should have both a reference value and the ability to trend from past analysis. The acid number often will jump considerably at some point. This may be your best indicator for when the oil is oxidizing rapidly and should be changed.


>*Gas compressors only ** Air compressors only ***For phosphate ester fluids, consult the fluid supplier and/or turbine manufacturer. R = Routine testing E = Exception test keyed to a positive result from the test in parentheses

The last section of the oil analysis report generally provides written results for each of the final few test samples along with recommendations for required actions. Typically, these recommendations are entered manually by laboratory personnel and based on information provided by the customer and the data collected in the lab. If there is an explanation for the data that stems from something not explicitly stated by the customer, the results must be reinterpreted by those familiar with the machine’s history of environmental and operating conditions. Understanding the information given here is critical. Remember, there is always an explanation for each exceeded limit, and the root cause should be investigated.

In addition to the raw data shown throughout the oil analysis report, graphs can help illustrate notable trends in the data. Below is an example of trended data points from analyzed data, with the water test having the most notable unfavorable spike. Along with the trend data, graphs should show typical averages, warning (marginal) limits and alarm (critical) limits. These limits should be modified depending on the type of data collected, the type of lubricant and the machine’s known operating conditions.

Standard alarm limits will be set by the oil analysis laboratory. However, if there is any reason to adjust these limits higher or lower, they should be identified properly. Examples of limits that should be lowered would be those for highly critical assets or assets that are consistently healthy. A small spike in data would be cause to run an exception test or an immediate second sample for analysis. In such cases, a second sample would ensure the data received is representative of the oil conditions and not simply a human error in sampling or analysis. If exception tests are needed, the chart above shows which tests would be appropriate when a given routine test limit has been exceeded.

Revised Laboratory Standard Approved by ASTM

$
0
0

The rapid pace of change in laboratory informatics tools over the last six years has led to a significant revision of ASTM E1578, "Guide for Laboratory Informatics."

The standard, which has been retitled from "Guide for Laboratory Information Management Systems" (LIMS), is under the jurisdiction of subcommittee E13.15 on analytical data, part of the ASTM international committee E13 on molecular spectroscopy and separation science.

"Laboratory informatics tools are used in lab environments across many industries, including health care, food, forensics, automotive, chemical, energy, manufacturing, mining, government/regulation, defense, nuclear and academic," says James Powers, managing partner of Bridge Associates LLC and chairman of the task group that revised the standard. "Laboratory informatics provides a vital link in the capture, processing, trending and reporting of information."

According to Powers, the scope of ASTM E1578 has been broadened to include the primary tools in today's laboratory informatics area. Examples include laboratory information management systems (LIMS), chromatography data systems (CDS), electronic laboratory notebooks (ELN) and scientific data management systems (SDMS). Additional terms related to laboratory informatics are now defined and new sections, including one on lean concepts and lab informatics, have been added.

"ASTM E1578 can be used to specify, select and enhance software tools used in laboratories to capture, analyze, trend and report laboratory sample, test and result information," says Powers. "Laboratory informatics tools can directly control instruments and the capture of data, which speeds analysis, lowers costs and improves the quality of test results."

Powers notes that information contained in this guide will benefit a broad audience of people who work or interact with a laboratory. A wide segment of laboratory informatics users, vendors and interested stakeholders participated in the recent revision of the standard.

For more information, visit www.astm.org.

Spectro and Lockheed Martin Sign Licensing Agreement

$
0
0

Spectro Inc. and Lockheed Martin recently signed an exclusive licensing agreement for Lockheed Martin's LaserNet Fines (LNF) fluid imaging and classification technology. The agreement will enable Spectro to enhance its present fluid analysis products and develop and manufacture new offerings based on the desktop, off-line version of LNF. Lockheed Martin will retain all rights with respect to its LaserNet Fines-Online fluid imaging and classification technologies and will continue to grow the product line.

LNF uses a pulsed laser diode, a digital charged coupled device (CCD) camera and advanced pattern recognition software to classify particle shapes while also providing accurate counts of particles larger than 4 microns. Lockheed Martin and the Office of Naval Research developed LNF to identify the type, severity and progression of mechanical wear issues by measuring the size distribution, rate of progression and shape of wear debris in lubricating oil.

"LaserNet Fines technology determines particle size, shape and rate of occurrence, and also provides other fluid condition data, creating an important diagnostic tool for maintaining and improving equipment performance," said Brian Mitchell, Spectro Inc. president and CEO. "We will continue to work closely with Lockheed Martin as they focus on expanding the LaserNet Fines technology for in-line and on-line applications."

LNF technology is currently a component of Spectro’s LNF Q200 analyzer, a desktop unit that provides particle size, count and shape data as well as viscosity information. The LNF Q200 has gained wide acceptance in Spectro’s core fluid condition-monitoring markets.

"LaserNet Fines is operational at sea, in factories and laboratories around the world," said Colleen Arthur, director of Integrated Defense Technologies for Lockheed Martin's Mission Systems and Training business. "Lockheed Martin is committed to growing its LaserNet Fines-Online product for continuous sampling of fluids for condition-based maintenance and other opportunities as they arise."

For more information, visit www.spectroinc.com.

Oil-Rite Introduces Adjustable-length Level Gages

$
0
0

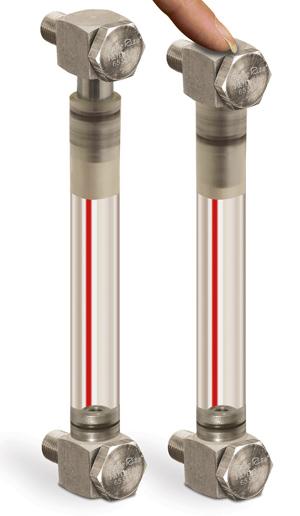
Oil-Rite Corp. recently introduced a new line of level gages with adjustable centerlines to accommodate centerline distances up to 1/4 inch longer or shorter than the specified measurement for total adjustability of 1/2 inch. This range of adjustability compensates for variances that can occur during the production of plastic tanks. It is also suited to field installations where the distance between mounting holes may be less precise than in a controlled setting. The adjustment can be made by hand, facilitating simple installation.

The gages feature a round nylon sight that is clear and durable. Liquid level and clarity can be viewed from all angles. A red line on the back of the sight enhances liquid level visibility. The length between the center of the two mounting bolts is referred to as the centerline. Gages are available with centerline measurements ranging from 6 to 36 inches.

The design offers a total adjustable range of 1/2 inch as opposed to conventional level gages that require mounting holes be within 1/32 inch of the gage’s centerline measurement.

Used to view liquid levels in hydraulic reservoirs, tanks, large steel-mill pumps, gearboxes, bearing housings, hydraulic equipment, crankcases, transformers and machinery oil reservoirs, the gages can be extended to many industrial liquid-level-viewing applications.

For more information, visit www.oilrite.com.


Panalytical Unveils New Spectrometers

$
0
0

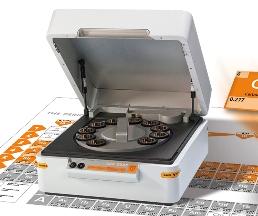
Panalytical recently introduced upgraded benchtop X-ray fluorescence (XRF) spectrometers incorporating the latest advances in excitation and detection technology. The new Epsilon 3X instruments have been designed for reliable and simple operation while delivering analytical performance across the periodic table.

The Epsilon 3X is equipped with 50-kilovolt excitation and a high-resolution silicon drift detector to enable analysis of elements from sodium to americium. The Epsilon 3XLE is configured with the more powerful SDD Ultra silicon drift detector, which makes analysis of ultra-light elements like carbon, nitrogen and oxygen possible. As inherent to XRF analysis, elements can be present in concentrations ranging from parts per million to 100 percent, with little or no sample preparation required.

Advanced spectrum processing and state-of-the-art algorithms provide accurate and fully traceable data. A variety of software options for standardless analysis, fingerprinting, regulatory compliance and multi-layer analysis are available.

"The smart combination of the latest excitation and detection technologies of the new Epsilon 3X benchtop spectrometers provides ultimate light-element performance, matching – and sometimes even surpassing — the analytical performance of larger, more powerful spectrometers," said Simon Milner, product marketing manager for Panalytical. "These cost-effective and highly flexible analytical tools are suitable for applications in a wide range of industries such as cement production, mineral beneficiation or polymer production."

For more information, visit www.panalytical.com.

Use Zone Inspections for Early Problem Detection

$
0
0

Early detection means frequent detection. While daily one-minute visual inspections have been discussed previously in Machinery Lubrication magazine, many questions remain, including where and how you inspect, what the observed conditions mean, and how you penetrate a machine’s exoskeleton exterior without X-ray vision.

There are three important inspection zones in common oil reservoirs and sumps. These zones have a story to tell about your oil and machine. They might be difficult to reach, but difficult does not mean impossible and certainly doesn’t mean unnecessary. Let’s get inside that exoskeleton and see what we need to know.

70% of lubrication professionals conduct daily visual inspections of the oil at their plant, according to a recent survey at MachineryLubrication.com

Level, Foam and Deposits (LF&D) Zone

Machines don’t just need some lubricant or any lubricant. Rather, they need a sustained and adequate supply of the right lubricant. Adequate doesn’t just mean dampness or the nearby presence of lubricant. What’s defined as adequate varies somewhat from machine to machine but is critical nonetheless. High-speed equipment running at full hydrodynamic film has the greatest lubricant appetite and is also the most punished when starved. Machines running at low speeds and loads are more forgiving when lube supply is restricted. Even these machines can fail suddenly when severe starvation occurs.

There are four keys to solving starvation problems using proactive maintenance:

  1. Identify the required lube supply or level to optimize reliability.
  2. Establish and deploy a means to sustain the optimized supply or level.
  3. Establish a monitoring program to verify that the optimized supply or level is consistently achieved.
  4. Rapidly remedy non-compliant lube supply or level problems.


Figure 1. An advanced case of deposits
accumulating on metal surfaces
above the oil level

For non-circulating wet-sump machines, slight changes in oil level can be catastrophic. These include bath, splash, oil-ring, flinger/slinger and similar lubricant supply methods originating from an oil sump. For these machines, frequent confirmation that the correct oil level is maintained has everything to do with machine reliability. This is best done by properly mounted and frequently inspected level gauges.

Some things float, and other things sink. What floats is lighter than oil. It rises by buoyancy. For instance, certain low-density additives can rise and form a visible film on the oil’s surface. Air bubbles, water vapor, natural gas and refrigerants are all buoyant. Once they get to the oil’s surface, they either release gases into the atmosphere or create bubbles. A stable layer of bubbles forms foam. Foam is disruptive for a variety of reasons, but most importantly it is associated with lubricant starvation. For more information on the causes and remedies of aeration and foam, see www.machinerylubrication.com/Read/690/aerated-oil.

Aeration and foam can be detected as long as you have a window. Sight glasses and level gauges mounted in ports that are centerline to the oil level enable this and should be included in a daily inspection program. This allows both oil level and aeration issues to be checked simultaneously. Optionally, hatches and access ports can also facilitate early detection of abnormal foam and aeration conditions.

Oil level sight glasses and internal tank inspections permit detection of surface deposits as well (e.g., varnish and sludge). The worst of this usually builds just above the oil level, called the splash zone, and looks similar to a tar-like bathtub ring. The cooler metal surfaces above the oil level enable splashed oil to deposit insoluble suspensions (condensation) that accumulate over time. These adherent gums and resins are associated with a range of problems that require early detection including oil oxidation, microdieseling and electrostatic discharge. An advanced case of this is shown in Figure 1. In a similar way, sight glasses can also be used for early detection of deposits. The acrylic or glass used often becomes fouled by deposits when high varnish potential conditions exist.

Bottom Sediment and Water (BS&W) Zone

Sooner or later gravity has a way of dragging things out of oil. On one hand, this is beneficial, as sedimentation and stratification of impurities can have a moderate cleansing effect on the oil. On the other hand, there are also many hazards and risks, which will be discussed later.


Figure 2. The three inspection zones in common
oil reservoirs and sumps

Most of the things you don’t want in your oil are heavier than the oil. These include hard solids (dirt, wear debris, corrosion debris, process solids, etc.), soft solids (sludge, agglomerated oxides, microbial contaminants, dead additives, etc.) and stratified liquids (e.g., free water and glycol).

Low-lying impurities can be referred to as bottom sediment and water (BS&W). BS&W includes all of the following:

  • Agglomerated sludge (accumulations of resinous solids, gums, oxides and dead additives)
  • Stratified solids (dense zones of soft contaminants, oxides and dead additives)
  • Sediment (settled hard contaminants like dirt and wear debris)
  • Water and other settled liquid contaminants (e.g., antifreeze)

Often the sludge and sediment found on the bottom of sumps and reservoirs are tightly bound by water. Most oil impurities are polar (water loving) in nature. When free and emulsified water contaminates an oil, this water can act as a mob to collect and bind together these impurities. Eventually, the growing sludgy mass is pulled by gravity to the sump floor. Dirt and wear debris that fell by normal sedimentation can also cling to these sludge pools.

How to Prevent the Fishbowl Effect

In an ideal world, you wouldn’t allow bottom sediment and water (BS&W) to accumulate, and oil changes wouldn’t be necessary. However, nobody lives in an ideal world. While you can’t eradicate BS&W in the real world, you can control its accumulation and resuspension by employing the following suggestions:

  • Use a BS&W bowl to monitor and periodically time the purge of BS&W “on condition.” This will prevent hazardous accumulations and help track the source and rate of generation.
  • After a needed oil drain, use a discharge wand from a filter cart to rinse out remaining BS&W from tank and sump bottoms before refilling with new fluid. Confirm that the rinse was successful by inspection.
  • After new oil has been added, circulate the fluid through a filter at the highest flow rate possible before the machine is started and put under load. Use a filter cart, if necessary. Allow the total oil volume to turn over no less than five times. Do a simple patch test or particle count to confirm cleanliness, especially for critical equipment.

Early Detection of BS&W is Key

As mentioned previously, BS&W is symptomatic of a host of problems and issues related to your oil and machine. Failed and degraded oil, environmental contaminants (e.g., dirt and water), active machine wear and corrosion all produce BS&W. It is important to know if BS&W is present so you can start the troubleshooting process and find the originating cause. This can be accomplished by 1) using BS&W bowls, 2) periodically taking drain port samples or 3) using a drop-tube vacuum sampler in which the tube is lowered to the bottom of the sump.

The seriousness of BS&W goes far beyond machine problems that produce sediment and water. BS&W can lead directly to sudden-death machine failure. For instance, disturbing the sediment in oil lubrication systems can produce what is called the “fishbowl effect.” Those who have had tropical fish know that the slightest agitation of an unchanged fish bowl causes the water to become murky with sediment, uneaten food and excrement. In the same sense that you wouldn’t want a loaded oil filter to burst, sending a dense debris field downstream, you also wouldn’t want to agitate the BS&W in your sumps and reservoirs. Imagine this sequence of events relating to an oil change:

  1. The drain port of a reservoir is removed, and the aged oil flows out by gravity into a waste oil container.
  2. Some of the BS&W is purged with the oil, but much of it stays clinging to the reservoir floor.
  3. During the drain, oil flowed by gravity toward the tank through piping, valves, pumps and filter housings, carrying suspended particles that were previously trapped in nooks and crannies. Some of these backwashed particles resettle in various locations, presenting the risk that they will be re-entrained into the oil when the machine is restarted.
  4. When fresh new oil comes plunging into the reservoir, the BS&W is stirred up into a murky mass.
  5. When the machine is restarted, the suspended reservoir muck and the displaced particles in the lines and machine components become mobilized by the flowing fluid and travel throughout the system.
  6. Some of these suspended particles induce accelerated wear in frictional load zones (bearings, gears, pumps, etc.), while others get trapped in narrow glands, oilways and orifices, causing restricted oil flow (starvation conditions).
  7. The dense concentration of particles and impaired oil flow start a chain of events that ends in machine failure. This happens more often than you might think.

Color and Clarity (C&C) Zone

Transitions in oil color and clarity (C&C) are common precursors to bottom sediment, sludge, varnish, emulsified water, entrained air and stable foam conditions. For this reason, it’s important to know when color and clarity changes are occurring. The oil is trying to tell you where it hurts.

Tracking C&C can be done by simple and routine visual inspections, such as:

  • Color Transitions - These are transitions from oil chemistry changes and color-producing contaminants. The observed oil color is typically compared to new oil and/or the previous oil that was sampled. Color bodies (chromophoric compounds) alert inspectors to degrading additives, base oil degradation and a host of contaminants possessing unique color markers.
  • Clarity Transitions - Clarity changes are generally due to the presence of suspended insolubles, entrained air and emulsions. These can range from a slight haze in the oil to cloudy/murky conditions. Advanced conditions result in the oil becoming completely opaque (pitch black). Good lighting is required during inspection, including the optional use of a strong laser light source.

C&C conditions relate to the active body of the oil and are less influenced by gravity and stratification. Still, C&C transitions can be seen when inspecting low-lying oil (tank drains and BS&W bowls) but also elsewhere, such as with an oil level gauge or inline sight glass. You can even examine the oil’s color and clarity in a bottle during routine sampling.


Figure 3. Three examples of using zone inspections

Color and clarity correlate to the transmission and spectral absorption of light by oil. Examples of conditions and contaminants that produce color and clarity transitions are shown in the table below.

Teaming Zone Inspections to Learn What’s Not Happening

While condition monitoring is about knowing what is happening to your oil and machine, it is also about what is not happening. For example, say you visually inspect your oil and machine in all three zones (LF&D, BS&W and C&C), and observe excellent, healthy conditions. What can you conclude? Well, you can determine that there are approximately 25 things that could be going wrong (in the oil and machine) that aren’t going wrong just because you have passing marks from these zone inspections. Among the multitude of things not occurring are the following:

  • Base oil oxidation
  • Thermal degradation
  • Additive stratification (dropout)
  • Microbial contamination
  • Free or emulsified water contamination
  • Air induction conditions
  • Impaired air-release conditions
  • Stable foam conditions
  • Antifreeze contamination
  • Sludge conditions
  • Varnish potential conditions
  • Varnish laydown conditions
  • Heavy sediment from a failed filter
  • Heavy sediment from contaminant ingression
  • Advanced machine wear conditions (certain cases)
  • Depletion of several important additives

Oil that is exhibiting issues like those in the list above will require urgent attention to troubleshoot and remediate the offending problem. If the cause of the condition(s) is unclear, laboratory analysis of the oil and/or BS&W may be needed.


A=Always, S=Sometimes, R=Rarely

It is worth emphasizing that these zone inspections are not a substitute for routine oil analysis. Also, samples that are routinely analyzed by laboratories should not be taken from the bottom of sumps and reservoirs. Instead, they should be extracted from live, turbulent fluid zones using the proper methods and tools.

For those who strive for lubrication-enabled reliability (LER), the opportunity comes from paying close attention to the “Big Four.” These are critical attributes of the optimum reference state (ORS) discussed frequently in this column and needed to achieve lubrication excellence. The “Big Four” individually and collectively influence the state of lubrication and are largely controllable by machinery maintainers. They are well-known but frequently not well-achieved. They are:

  1. Correct lubricant selection
  2. Stabilized lubricant health
  3. Contamination control
  4. Adequate and sustained lubricant level/supply

It is comforting to know that the last three of the “Big Four” can be largely examined and confirmed by employing a rigorous zone inspection program. Yes, early detection means frequent detection. It’s within your control. Opportunity knocks!

Why an Oil's Base Number Drops

$
0
0

"What could be the possible reasons for the base number of our gasoline engine oil becoming depleted to 1.2 milligrams of potassium hydroxide per gram (mgKOH/g) after 2,175 miles? The amount of oil was also reduced in the engine when gauged."

Base number (BN) is a property used to monitor combustion engine oils. It is defined as the oil's ability to neutralize acids that are formed as a byproduct of combustion, chemical reactions and oil degradation. Typically, the higher the BN, the more acid it will be able to neutralize. New engine oils usually have a BN range of 5 to 15. As oil is used in service, it becomes contaminated with acids, causing the base number to drop over time. The rate of the drop is determined by the amount of acids introduced to the system.

By using oil analysis for your engine oil, you will be able to track the BN of your oil and determine how much life is remaining. Once the base number drops below 3, this is considered too low and should trigger an oil change for your engine.

The most common reasons for a drop in the base number are related to low-quality fuel and oil oxidation. During combustion, a low-quality fuel with high sulfur content can produce sulfuric acid, which attacks the oil and causes a drop in the base number. Oil oxidation as a result of the engine overheating or an attempt to extend the oil drain interval is another reason you may see a drop in the BN.

In the case of a 1.2 mgKOH/g result after only 2,175 miles, there is something very wrong. The quality of the oil could be the culprit. If a low-quality lubricant is used, it may not be fortified with the proper additive package and thus not be able to handle the acid formation. There could also be operational or mechanical issues.

A more appropriate measure of service for this engine may be hours instead of mileage. Imagine the difference between a taxi that spends the majority of its time waiting at an airport to pick up passengers (idling) vs. a highway transport that spends the majority of its time at 65 mph. The taxi may run for more than 500 hours to get to 2,175 miles, while the highway transport could achieve this in only 35 hours of runtime.

Mechanically, fuel could be entering the crankcase and causing dilution. This will also result in the rate of BN decay to increase.

Further testing will be needed to make a final determination. The flash point can help to establish if any fuel is finding its way into the lubricant. A result of 1.5 to 2 percent would be cause for concern. Viscosity is also a good indicator of fuel dilution. If a sample of the new oil is available, Fourier transform infrared (FTIR) spectroscopy could provide a good indication of nitration (blow-by). 

These are not the only reasons for a depletion of the base number, but they are considered the most common. The severity obviously attributes to the rate, and in this case (1.2 mgKOH/g after only 2,175 miles), there must be significant influence from multiple sources. 

Is Oil Analysis a Waste of Time?

$
0
0

How confident are you in your oil analysis data? Are you using it to make critical decisions about machine maintenance, production or shutdown schedules and machine rebuilds? How can you be sure you are getting the best information to make these decisions?

As I travel around the world helping companies design, implement and improve their oil analysis programs, I can’t help but question the validity of their past results. There are several fundamentals that must be performed correctly to get the maximum value from an oil analysis program. These concepts are fairly simple once you consider the effects each one could potentially have on the overall program.

Selecting Machines

At what point do you deem an asset important enough to the company’s mission to warrant spending extra time, money and energy to ensure the reliability of that asset? When I am designing an oil analysis program, I use two main criteria for determining which machines require sampling: sump size and criticality. These two factors are somewhat related.

Imagine a machine that is not critical to the plant’s process yet holds several thousand gallons of fluid. You would want to conduct testing on this oil to ensure you are getting the most useful life from it and not throwing it away prematurely based on a calendar change-out (condition-based vs. interval-based change).

Likewise, if a machine is critical but holds very little oil, you would also sample the oil even if it meant taking a large percentage of the oil from the housing and having to top-up. This sample is not to test the oil quality, age or properties but to obtain information about the machine’s health.

Sampling Frequency

Sampling frequency is influenced by several variables, including the economic penalty of failure, fluid environment severity, machine age, oil age and target tightness.

Economic Penalty of Failure

The higher the penalty of failure, the more often a sample should be taken. The penalty of failure must take into account the cost of downtime, the cost of repair or rebuild, the overall interruption to business and the impact on product quality or output.

Fluid Environment Severity

Fluid environment severity includes more than just the opportunity for particulate, process chemical and moisture contamination but also takes into account the demands placed on the lubricant by the machine. This includes the pressure, speed and load as well as the duty cycle. The greater the risk of lubricant damage, the more frequent the sampling.

Machine Age

The likelihood of machine failure can be tied to machine age. A machine has the likeliest possibility of failure when it is brand new (infant mortality) and when it has exceeded its maximum useful life. Sampling frequencies must be modified according to the classic “bathtub” curve used to explain this probability of equipment failure. For this reason, sampling frequencies must be increased during these periods of higher failure probability, especially when analysis results indicate impending machine mortality.

68% of lubrication professionals are confident in their oil analysis data, based on a recent poll at MachineryLubrication.com

Oil Age

The age rule applies to lubricants as well. Aside from the obvious new oil sample for baseline purposes, the lubricant needs a frequent recheck in the first 10 percent of its expected life. This is particularly true when a new oil type or manufacturer is used.

Target Tightness

The final consideration is the tightness of any goal-based limits. For example, if the ISO code 15/13/10 is set as the fluid cleanliness target and the average fluid cleanliness is normally around 14/12/9, then this would be considered tight. However, if it typically trends at 11/9/6, then this would be considered loose. Tight targets require more frequent sampling because the possibility of exceeding the target will occur more readily than with relatively loose targets.

Sampling Locations

A sample taken from an incorrect location can kill the accuracy of your oil analysis program. Understanding the differences between primary and secondary sampling ports can help you choose the proper sample location.

Primary Sampling Ports

The primary sampling port is where routine oil samples are taken. Oil from this sample location is generally used for monitoring contamination, wear debris and the oil’s chemical and physical properties. Primary sampling locations vary from system to system but are typically located on a single return line prior to entering the sump or reservoir.

Secondary Sampling Ports

Secondary sampling ports can be placed anywhere on the system to isolate upstream components. This is where contamination and wear debris from individual components will be found.


*10 = High, 1 = Low

Sampling Procedures

Developing and deploying effective sampling procedures may be the most important factor in achieving oil analysis success. Sampling procedures ensure data consistency and instill confidence in the decisions made with oil analysis information. The following steps are considered best practice when creating procedures:

  • Make the development of sampling procedures a team effort. All the individuals on the team have meaningful experience and viewpoints that should be incorporated in the procedure.
  • Get necessary help from an expert. Instead of reinventing the wheel, employ someone with the necessary expertise to support your effort. Be careful not to simply “farm out” this important activity. Outside support should provide guidance to the team, not replace it. Ownership is too important to not maintain internal involvement in the process.
  • Automate the process if possible. Internal “intranet” information systems are great places to store procedures so they will be available to anyone at the plant who needs them and is authorized to access them.
  • Routinely update procedures. New and better sampling methods are created every day. Be sure your procedures are evolving to incorporate these improvements. It might be wise to employ an outside expert to help keep you up to date and make necessary revisions. Your objectives also change over time. The impact of these changes on your oil analysis program should be captured in the sampling procedure.

Lab Selection

Partnering with an external oil analysis lab is a strategic decision. In far too many cases, price is the overall decider. Other aspects of the oil analysis service should be considered, including available tests, interpretation skills and turnaround times. Visit a few labs before making a decision because it is hard to tell a good lab from a poor one by just looking at an output report.

Test Slates

Most used oil analysis labs offer a list of tests from which users are expected to choose a test slate that will be appropriate for their equipment. If the correct tests are not selected, vital early warning signals and opportunities for maintenance cost savings can be missed. Recommended test packages for different equipment should include both routine and exception testing for a two-dimensional approach to oil analysis.

Alarms and Limits

The primary purpose for alarms and limits is to filter data so technicians spend their time managing and correcting exceptional situations instead of pouring over the data trying to find the exceptions. The alarm serves as a filter to tell the analyst that a threshold has been passed and that action is required. Some data parameters have only upper limits such as particle counts or wear debris levels. A few data parameters employ lower limits like base number, additive elements, flash point and oxidation stability. Other data parameters like viscosity use both upper and lower limits. These generally relate to important chemical and physical properties of the lubricant where stability of these properties is desired.

Data Analysis

To get great results from your oil analysis program, there must be a process in place for analyzing the data. Of course, it is done at the lab, but how much does that analyst really know about your machine? When you combine a good program with an individual who knows the machines as well as how to read and interpret a report, your program has the ability to become great.

Remember, if oil analysis is not done correctly, it becomes a waste of time, money and energy. Everything must be done to the highest standard for the true value to be revealed. Take the next step. Learn how Noria can help transform your lubrication program.

New Test Method for Lubricant Biodegradability

$
0
0

Following criticism of the Coordinating European Council’s well-known biodegradability test (CEC-L-33-A-93) for its use of hazardous solvents, and with alternative tests not designed for testing lubricants, a technical development group (TDG-L-103) was formed to establish a replacement test method. After 3½ years, a new biodegradability test procedure has been developed, thoroughly tested and approved. It essentially measures the loss of oil and oil-soluble metabolites over 21 days in a nature-like aqueous environment.

Before presenting the new test method, an understanding of biodegradation may be useful.

Biodegradation

Biodegradation of organic material (natural or synthetic hydrocarbon compounds) is actually biochemical oxidation. It is initiated and performed by the enzymes of micro-organisms such as algae and microfungi. Although similar to combustion, this biochemical process is much longer, comprising several small bio-oxidation steps via long-chain alcohols and carboxylic acids, as well as shorter chain acids down to acetic acid and carbon dioxide. This process delivers energy to the micro-organisms. There is also another side reaction inside these “microbugs” that uses long-chain carboxylic acids for the formation of amino acids and proteins. This reaction makes the micro-organisms grow in size and number.


Biodegradation of hydrocarbon compounds

When oil or other organic material is spilled into natural water containing the usual micro-organisms, the initial speed of biodegradation is very slow, as not all “bugs” present will accept this material as “food.” Those that do will eat and grow in number and size, thus producing a faster biodegradation speed until this food (the added substrate) is fully consumed.


The biodegradation process

The resulting degradation/time curve of any organic material usually has three stages: the lag (or adaptation) phase, the degradation (or exponential) phase and the stationary phase, where the new biomass will die away if no additional food is added. This type of degradation curve is found whenever the concentration of added organic material is observed. However, when the resulting carbon dioxide is measured, the shape will be somewhat different due to the side reaction into proteins and the time-consuming dying-off process of the biomass produced. This should be noted when comparing the results of oil removal tests with other methods measuring carbon-dioxide production.


Kinetics of biodegradation

Test Development

The establishment of a new test method for biodegradability began in late 2008 with the formation of the CEC Technical Development Group L-103. It was comprised of three active laboratories and a few industry experts. The group was charged with keeping the basic principles and advantages of the CEC-L-33-A-93 test, such as having a clearly defined oil incorporation procedure, using reference oils, and being suitable and proven for all types and chemistries of oils on the market, especially all types of bio-lubes. In addition, the group was to avoid hazardous solvents, exceed the L-33 test in repeatability and reproducibility, and match the test quality and surveillance criteria of the 2001 guidelines set by the CEC.

Just like the CEC-L-33-A-93 test, the new test’s basic principle involves preparing a “mineral medium” (similar to natural surface water) that contains some mineral salts and natural micro-organisms. A small volume of oil and a carrier are added to prepare the test flasks, with biocide used for poisoned flasks and no addition made to neutral flasks. The oil contents of these flasks are analyzed and compared on the starting day and after 21 days of incubation in the dark with mild shaking at 25 degrees C. In all, 15 flasks are prepared for each candidate and reference oil - five for instant analysis and 10 for analysis after 21 days of degradation.


Preparation of test flasks for the new biodegradability test

In the initial version of the CEC-L-33 test, the carrier material used to introduce the test oil into the aqueous medium was carbon tetra-chloride. Ethylene tetra-chloride or Freon was prescribed after 1993. The same hazardous solvents were also used to extract the non-degraded oil portion for quantitative infrared spectroscopy analysis after three weeks. Excluding the use of such solvents was found to be a significant challenge in the L-103 test development. Eventually, high-temperature gas chromatography was employed for the analytical evaluation of oil concentrations instead of infrared spectroscopy.

Gas Chromatography

Conventional gas chromatography (GC) is a good tool for qualitative and quantitative analysis as well as for producing simulated boiling curves of organic material with a minimum volatility. Lubricants of low and medium viscosity are also suitable for GC analysis but not heavy materials and esters.

High-temperature GC is a development of the last 10 years that has widely overcome these limitations and works well with all types of lubricating oils. Even polymeric components can be analyzed with good precision. Modern high-temperature GC analyzers are highly automated and can offer amazing precision, which enables test flask volumes to be reduced.

Another advantage of GC analysis is that it allows the extraction of residual oil at the end of the test through the use of ordinary, non-toxic hydrocarbon solvents. However, such solvents are not helpful for introducing the oil sample into the aqueous test medium.

An effective biodegradation test must provide equally good dispersion conditions for all types of materials and products. The identification of such a “co-solvent” was an important step in the development of the new test method. This was followed by the exchange of mercury chloride in the abiotic (non-biological) “poisoned flasks” in favor of a mild but efficient organic biocide.

As prescribed for every CEC test-development process, the new procedure had to prove sufficient repeatability and discrimination with two reference oils. In the first phase of development, five repeat tests with two reference oils were conducted in each of the participating laboratories. Very good repeatability was seen in one of the cooperating labs, and clear discrimination of the two tested products was evident in all three laboratories. The average repeatability of all three labs was better than in the CEC-L-33 test.

Round-robin Exercise

The second phase of the CEC test-development process involved the demonstration of the method’s reproducibility in a minimum of five test laboratories. Three additional labs with suitable equipment and skills were located. The active labs in this phase included three independent commercial test labs, one additive supplier, one oil supplier and one governmental lab.


Results of the repeatability exercise in phase one of the test-development process

A round-robin exercise was then conducted according to the guidelines set by the CEC with guidance from the Statistical Development Group (SDG). Each lab tested four oils in parallel. One month later, the same oils were tested again using fresh inoculum. This would provide a final judgment on the new test method’s discrimination, repeatability with the same inoculum (batch of micro-organisms), repeatability with another inoculum in the same lab and reproducibility in six different labs using six different inocula.

The average biodegradability results of the six labs were in the range of 35 to 40 percent with mineral base oils and formulations, 70 to 90 percent with synthetic base stocks and oils, and 90 to 100 percent with vegetable oil products. These results showed clear discrimination of high and low biodegradability, with ranges similar to many results associated with the CEC-L-33 test.

The repeatability of the four samples was calculated at 4 to 7 percent using identical inoculum and 7 to 14 percent using different inocula, with 12 to 19 percent reproducibility. The best figures were seen at high degradation, and the worst at lower degradability. This was not surprising considering the degradation/time curve in which the daily degradation rate is low above 80 percent but high in the 30- to 70-percent range. This led the technical development group in an earlier stage to switch from the “high” reference oil (RL 130) used in the L-33 test with 80- to 90-percent degradation to an alternative synthetic (RL 245) with degradation values near 70 percent.

Nevertheless, the precision data of the new test marked a big step forward in comparison to existing tests, as the reproducibility of the CEC-L-33 test had been 19 to 38 percent in 1991, and the reproducibility of the Organization for Economic Cooperation and Development’s test (OECD-301) using only water-soluble chemicals had been 19 to 40 percent in 1988.

The round-robin exercise made the effect of the individual inocula (bacterial batches) quite obvious. Using two different inocula in the same lab brought the repeatability figures up into the range of the reproducibility. Thus, the relative activity of the micro-organisms was a factor with equal importance as the individual lab and operator.


Biodegradation of oils after 21 days

Two options were found to minimize or remove this undesired variation through microbial activity. First, each candidate test result must be achieved consecutively with a test of RL 245. In addition, the test result is valid only if the RL result is within the 10-percent range of the last round-robin test’s average. Second, inoculum preconditioning, which involves putting each inoculum into a well-defined environment of standard nutrients before the oil test, was shown to reduce the number of individual species and the individual behavior of the inoculum.

Benefits of the New Test Method

The new test procedure is equally suitable for all types of lubricating oils, base stocks and formulations except water-soluble products. It avoids the use of toxic or harmful chemicals, reduces the overall consumption of chemicals and biomass, and increases test precision. It also offers a good way to simulate the fate of lubricating oil spilled in small quantities within the environment, such as during the operation of chainsaws or two-stroke engines.

Summary of the New Lubricant Biodegradability Test Procedure

The new test method (CEC-L-103-12) provides a procedure to evaluate the biodegradability of lubricants in natural water. It is performed in direct comparison with at least one reference oil. Lubricants tested may be base oils or contain usual additives. Base oils can be conventional mineral, hydrogenated/hydrocracked oils, PAOs, synthetics, natural (vegetable) esters or mixtures thereof.

The required hardware for the test includes standard glassware, a shaker tablet and a high-temperature gas-chromatographic column and analyzer. The test medium is natural water from a defined source (comprising a defined level of micro-organisms) enriched with defined nutrient mineral salts.

The test is set up to simulate biodegradation in natural water, i.e., ground water or open rivers, lakes or sea. There is also good correlation with biodegradation in wet soil with the presence of sufficient air/oxygen as well as in biological sewage plants.

The lubricants tested are introduced by pre-dilution with a special solvent. After a 21-day degradation period, the oil content of the test flasks is compared with the original oil concentration and with poisoned (abiotic) reference flasks using oil extraction and a high-temperature GC analyzer. This procedure ensures all original oil and the products of primary biodegradation (long- and medium-chain hydrocarbons, esters, alcohols and fatty acids) are counted as “non-degraded” in the final test evaluation.

Test results provide the percentage of biodegradation over three weeks. For example, a result of 70 percent would indicate that 70 percent of the test material has been degraded biologically over 21 days down to carbon dioxide, protein (cell material) or metabolites that are readily soluble in water and are on a direct biochemical path to ultimate degradation.

Laboratories beginning to perform this new test procedure will need training and experience until they are able to produce valid results. However, the test description contains a number of hurdles and checkpoints that help make insufficient accuracy obvious and grant a high degree of reliability for all valid results.

Of course, there remain several issues that are not sufficiently covered by this or other test methods. For instance, no standard test method exists for simulating biodegradation of severe oil spills in a limited volume of water or soil, as in the cases of accidents with tank cars or mobile hydraulic systems. The main problem in such accidents is oxygen starvation that can lead to severe environmental damage. More research and possibly new test methods may be required to rate products for these real-world conditions.

In addition, during the technical development group’s work, a few tests were conducted with lubricating greases, which produced reasonable results. However, these tests were performed only with low NLGI grades and in a limited number, so the new test procedure cannot be recommended for lubricating greases in general. This may be the subject of further investigation and possibly an optimized test procedure.

Please note that CEC test methods do not define limits for “good” or “acceptable” behavior of candidate oils. This is generally left to those who use CEC test procedures to set specifications, such as the DEKRA product-specific rules guideline for sustainable hydraulic fluids, which was the first specification using the new CEC-L-103 test.

Emergency Testing Order Issued for Transport of Crude Oils

$
0
0

The U.S. Department of Transportation (DOT) recently issued an emergency testing order that requires all shippers to test crude oil from the Bakken region to ensure proper identification before the oil is transported by rail.

The order is in response to a number of recent incidents involving the derailment of trains transporting crude oil from Canada to the United States. The estimated cost of the damages from these accidents has topped $1 billion and caused significant environmental damage.

Accident investigations have highlighted the need for more accurate classification of crude oils. Classification has often been based solely on safety data sheets, which frequently are outdated.

As a result of these investigations, the DOT issued several emergency testing orders with the most recent amended version issued on March 6, 2014, and addressed to shippers of petroleum crude. The order specifically requires the flash point and boiling point testing of crude oils and endorses the requirement that crude oil shipments follow volatility testing defined by hazardous material regulations (HMR).

In HMR, the testing of crude oil vapor pressure is critical in determining the requirements for safe packing for transport. A derailment can result from the boiling over of crude oils from too much pressure in a rail carriage. This risk increases significantly if the crude oil includes gaseous components.

For more information, visit www.grabner-instruments.com

Why an Oil's Flash Point Drops

$
0
0

"This winter we sent a sample of a 220-centistoke extreme-pressure gear oil to our lab for routine analysis. The oil was used in an outdoor gearbox for about two years in Canada. Most of the analysis results appear normal (viscosity is 217 centistokes at 40 degrees C, only 100 parts per million water and the acid number is 0.65). However, the flash point is 76 degrees C, which is well below the new oil level of 190 degrees C.

A second sample sent to the lab confirms the results of the first test. What could have caused the flash point to drop so dramatically while the viscosity and acid number are at near normal levels? What inspections of the gearbox could have confirmed our suspicion? What risks could this condition present? How could the root cause be corrected?"

For a definitive answer, many elements relating to oil analysis and machinery maintenance must be known. For instance, was the new oil analyzed and what was its viscosity? Is there a baseline for comparison?  Also, was the oil sample collected in the right manner? What are your maintenance practices? Are top-up containers and machines properly labeled so the correct lubricant is used with the correct machine? What training do technicians have? These are some of the key factors that can affect the health of the lubricant and the oil analysis results.

A flash point that drops suddenly could potentially cause an explosive situation. Any source of ignition could spark a reaction. Remember, flash point is the lowest temperature at which an ignition source causes the vapors of the lubricant to ignite under specified conditions. Machinery seals can also be affected, resulting in unforeseen leaks, equipment damage or further contamination of your oils.

Base oil cracking is just one example of what can happen if the flash point drops. This can occur if machines and components are placed in proximity to steam or furnaces. Regardless of the machine, location or heat source, if the lubricant temperature exceeds 550 degrees C, there is a risk of cracking. 

Several things can help guard against this, such as having a proper baseline for the new oils in order to have a true comparison when oil analysis tests are conducted. Performing Fourier transform infrared (FTIR) spectroscopy can help you discover what contaminants could be in the lubricants that may not show up in other test slates.

Also, ensure technicians are trained in proper sampling techniques to prevent false-positive readings due to contamination. World-class lubrication storage and handling procedures should be practiced to prevent lubricants from being contaminated.

It is likely that a chemical has contaminated your lubricant. This may have occurred in the sampling process or because of poor handling or machine maintenance practices. In this scenario, more data is needed. Any type of historical baseline data would be helpful, such as FTIR, water, viscosity and elemental testing. 


Predicting Machine Failure with Oil Analysis

$
0
0

How can you predict when a machine is going to fail? While there are many predictive technologies available, including vibration monitoring and thermography, do not overlook oil analysis. Oil analysis can be a powerful predictive technology. This 2-minute, 2-second video explains how to obtain a representative oil sample from a live-zone area so you can see what is going on inside a machine and monitor the wear rate. 

Spectro Inc. Changes Company Name to Spectro Scientific

$
0
0

The fluid analysis instrument company formerly known as Spectro Inc. recently announced that it has officially changed its name and undergone a comprehensive corporate rebranding.

"From today forward, the company becomes Spectro Scientific to more accurately reflect our deep roots in the science of fluids analysis," said president and CEO Brian Mitchell.

Spectro Scientific and its subsidiaries, including Wilks Enterprise of Norwalk, Conn., specialize in analytical instrumentation, software and services for industrial performance fluid analysis. It is one of the largest worldwide suppliers of oil, fuel and processed water analysis tools to industry and the military. Clients include petrochemical, mining, power generation and offshore oil drilling companies as well as commercial testing laboratories.

"Our products enable customers to make confident, knowledge-based decisions whether that be in a laboratory or field environment," explains Mitchell. "With our instrumentation, users can make quicker, more informed decisions regarding asset utilization, maintenance, risk management and regulatory compliance matters."

In recent years, the company’s product development focus has been on portable, easy-to-use, fluid-performance analysis solutions that facilitate high productivity, repeatability and accuracy. One example is the multipurpose Q5800 portable measurement tool that combines abnormal wear metals analysis, particle counting, viscosity and infrared spectroscopy in one compact, field-based system. The battery-powered device facilitates maintenance of high-value equipment, enabling complete lubricant assessment for condition monitoring and rapid results that permit immediate maintenance and reliability decisions.

"The Q5800 is just one example of innovation based on sound research, which is at the root of everything we do here at Spectro Scientific," Mitchell says. "We truly are an organization grounded in science. Now, our name, logo and brand promise signify who we are, what we do and where we are going."

For more information, visit www.spectrosci.com.

Spectro Scientific Unveils New Oil Testing Instruments

$
0
0

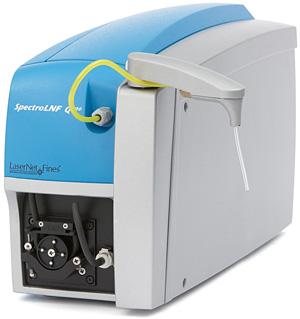
Spectro Scientific recently introduced a new series of instruments for oil analysis, condition monitoring and maintenance and reliability programs.

The LaserNet Fines (LNF) Q200 Series is an analytical platform that offers a particle counter, wear particle classifier and ferrous monitor in one scalable and upgradeable package.

The LNF technology, which was developed through a partnership with the U.S. Navy, provides particle counts and codes, abnormal wear classification, ferrous wear measurement, and free water calculation. The Q200 is simple to use and yields rapid results.

"These instruments allow operators to monitor equipment conditions quickly and easily," explained Brian Mitchell, Spectro Scientific president and CEO. "All devices in the LNF Q200 Series require no calibration and feature an intuitive, easy-to-use GUI so that operator training can be accomplished in hours, not days."

The Q200 series is designed specifically for in-service lubrication oil analysis. The system works on dark fluids containing up to 5 million particles per milliliter or 2 percent soot with automatic laser control. It differentiates between water and air bubbles while also providing error corrections.

The LNF Q200 Series is available in three configurations to best meet the needs of different facilities. The Q210 features a particle counter with the unique capability to segregate wear particles from dirt ingress, while the Q220 adds the LNF automatic shape classifier. The Q230 configuration includes the particle counter, automatic shape classifier and a magnetometer that quantifies and trends ferrous content in the form of an actual calibrated measurement of the ferrous content in parts per million by volume. Viscosity measurement and an automatic sample changer are available on all models.

For more information, visit www.spectrosci.com.

Why Clear and Bright Oil Samples are Not Good Enough

$
0
0

Before joining Noria as a technical consultant, I served in the U.S. Navy where I was stationed aboard the USS Saratoga and assigned to the oil lab. Prior to placing equipment into operation onboard the ship, we would draw an oil sample and conduct a visual analysis. If the sample was “clear and bright,” it was considered acceptable, and the equipment was placed into service. I now know that using the “clear and bright” standard is not nearly good enough. Particles that cause the majority of damage in equipment are smaller than can be seen with the naked eye, and lube oils can contain up to 0.1 percent water and still be “bright.” Keep in mind that at 0.1 percent water, 75 percent of the bearing’s life may have been lost.

Case Study: USS San Antonio

The USS San Antonio was commissioned on Jan. 14, 2006. Shortly after being placed into service, the ship began to develop serious mechanical issues with its main propulsion diesel engines. The failures were the result of several factors, which were not all contamination-related. The Navy conducted an investigation into the causes of the engine failures. Several issues were discovered, with a good number of them resulting from poor contamination control. In the investigation’s report, it was noted that the lube oil service system design used muslin bags and that particles smaller than 25 microns would pass through the filters. During inspections of the engine oil sumps, welding slag, paint chips, inorganic fibers and free water were found. It was also reported that the system configuration allowed contaminants to recirculate through the pump. These contaminants would be macerated until they were able to pass through the filter.

Oil Analysis in the Navy

The following excerpt is from the Navy’s Machinist Mate 3 & 2, which is the advancement training guide for steam plant operators, heating and air conditioning technicians, and ship oil kings:

“Lubricants must be maintained at specified standards of purity and at designed pressures and temperatures. Without proper lubrication, many units of shipboard machinery would grind to a screeching halt.”

Note the phrase “specified standards of purity.” Prior to starting a piece of equipment, one of the requirements is to draw an oil sample. This sample is sent to the shipboard oil lab for analysis. According to the Machinist Mate 1 & C, the procedure is as follows:

“The visual test must meet the clear and bright criteria. Clear refers to the lack of particulate matter in the sample. Particulate matter cannot cover more than one-quarter of the bottom of the sample bottle. The bright criteria refer to the lack of free water in the sample. Entrained water can dull the lube oil sample. If the sample is dull, try to read a PMS card through the sample. If you can read the PMS card, it passes this test. If it does not pass the visual test, you need to run a BS&W test. Be careful of entrained air that may dull the sample. If you are unsure whether air or water is the cause of the dullness, let the sample settle a few minutes. Air will clear to the top of the sample; water will settle to the bottom.”

If the oil sample contains particles longer than 1/8 inch along any axis or if visible sediment is noted, the procedure is to let the sample bottle sit for 10 minutes and then lay it on its side for 10 minutes or until all visible sediment has settled to the bottom. If this results in a solid line, a bottom sediment and water (BS&W) test is required. The BS&W test involves spinning 100 milliliters of the oil sample at 1,500 revolutions per minute for 30 minutes and then recording the results. Generally, results of less than 0.1 percent by volume are acceptable.

Samples are sent periodically to a Navy oil analysis program laboratory for testing. The test slate will be dependent on the type of oil and the associated equipment class. The table above shows the test slate based on fluid and application types.

For oils designated for equipment lubrication, a spectrometric analysis is conducted to track wear metal concentrations for trending and troubleshooting. Among the metals that are tested for include iron, nickel, sodium, lead, silver, phosphorus, copper, tin, zinc, chromium, silicon, calcium, aluminum, boron and barium. The National Aerospace Standard (NAS) classification reference is to the NAS 1638 standard, which was used to indicate particle counts. It has been discontinued and replaced with SAE AS4059E.


The NAS 1638 Contamination Classification System, which has been
discontinued and replaced with SAE AS4059E


Inherent Problems

The problems associated with using clear and bright as acceptance criteria for lubricants in operating machinery should be fairly obvious. “Clear” refers to the lack of particles, which are generally measured in microns. One micron is 39 millionths of an inch. The human eye can see particles down to the 40-micron range. A human hair is between 30 and 120 microns. The oil film on a journal bearing runs from 5 to 200 microns, but on rolling-element bearings, it is usually less than 1 micron. The table below offers a comparison of clearances for various components.

Suffice it to say, it would be nearly impossible to see the particles that are doing the damage. Particles in the size range of the working clearance cause the most damage. Several of the larger pieces of marine equipment use journal bearings, so to a certain degree they are designed to be more forgiving of the smaller, submicron particles. However, in the case of rolling-element bearings, it is a different story. As previously stated, the lubricant film in rolling-element bearings is usually less than 1 micron.

According to SKF, the cleaner the lubricant, the longer bearings will last. In fact, the bearing company has gone so far as to state, “Bearings can have an infinite life when particles larger than the lubricant film are removed.”

SKF has conducted case studies and determined that roughly 70 percent of bearing failures are due in part to contamination. Similar studies show the benefits of controlling particle contamination. For instance, Nippon Steel was rewarded for its contamination control efforts with a nearly 76-percent reduction in pump replacement frequency, a 75-percent reduction in oil consumption, an 80-percent reduction in hydraulic repairs and a 50-percent reduction in bearing purchases. Likewise, after BHP Billiton improved filtration at one of its mills, production increased nearly 3.5 times. These are just a few examples of the benefits to be gained from controlling particle contamination.

“Bright” refers to the presence of water. Whoever made the statement that oil and water do not mix was just plain wrong. Nearly all oils have a certain quantity of dissolved water, and this dissolved water will not be evident by conducting a visual test. Oil will contain a quantity of water up to the saturation point and still appear clear.

According to SKF, “The presence of water in lubricating oils can shorten bearing life down to 1 percent or less, depending on the quantity present.”

Oil can actually carry up to 2,000 parts per million of dissolved water before reaching its saturation point and beginning to appear cloudy.

In his Machinery Lubrication article on how water causes bearing failure, Jim Fitch explained several modes of failure caused by water in oil. Among these are hydrogen-induced fractures, corrosion, oxidation, additive depletion, oil flow restrictions, aeration and foam, impaired film strength, and microbial contamination. A few of these modes are less obvious as to how they operate than others.

In regard to impaired film strength, lubricating oils have a unique property known as the pressure-viscosity coefficient. Simply put, the higher the pressure, the higher the viscosity. The pressure in the load zones for rolling-element bearings is often in excess of 500,000 psi. This causes oil to almost become a solid, and it will maintain the separation between the rolling element and the raceway. The viscosity of water is one centistoke, and regardless of pressure, it stays essentially at one centistoke. Therefore, water will not be sufficient for maintaining the separation between the rolling element and the raceway.

It should now be readily apparent that it is not a sound practice to simply utilize the clear and bright criteria for determining whether oil is acceptable to use or for deciding whether equipment can be placed into service.

As far as I know, the Navy currently has no means of tracking the number of bearing failures it experiences over the course of a year. It would be interesting to see these statistics and the associated costs. If your organization is using the same methodology as the U.S. Navy, you likely are losing a large amount of money every year.

Passion for Improvement Leads Crooks to Successful Oil Analysis Program

$
0
0

Name: Mark Crooks

Age: 59

Title: Mechanical Foreman

Years of Service: 34 years

Company: SaskPower

Location: Saskatchewan, Canada

Four years ago, a change in management at SaskPower’s Poplar River Power Station (PRPS) in Saskatchewan, Canada, led to a new way of thinking. Mechanical foreman Mark Crooks was asked to initiate and implement a lubrication program and improve on anything that was already in place. When Crooks asked, “Why me?” he was told, “You have a passion for improving the lubrication problems in the plant.” Over the past three years, Crooks has been in the lead support role for the company’s oil analysis program and has been educating employees on the importance of clean oil, proper oil handling and keeping oil reservoirs and gearboxes as clean as possible. He knows that once these ideas become common practice and the routines become a habit, everything will start to flow more smoothly.

Q:How did you get your start in machinery lubrication?

A: I started my career with SaskPower in 1979 as a dragline oiler. At the time, the company ran draglines with 400-foot booms and 90-yard buckets. I graduated to dragline operator and held the position for five years. I then moved to a coal-fired power plant in Saskatchewan and worked as a coal handler until I was appointed to an apprentice millwright position. I worked as a journeyman millwright and then as a mechanical foreman. This included working with and supervising welders, machinists and millwrights, as well as various contractors. I have been in the oil analysis business for three years.

Q:What types of training have you taken to get to your current position?

A: As a dragline oiler and operator, I took a basic lubrication principles course. I also have my supervisor’s certificate for open-pit mining. As a journeyman millwright, I completed an introduction to vibration technology course as well as a reliability-centered maintenance program. I have taken courses for steam turbine generator maintenance and oil analysis for proactive maintenance.

Q:What professional certifications have you attained?

A: In 1992 I received my industrial mechanic (millwright) provincial trade certification, and in 2011 I earned my Machine Lubricant Analyst (MLA) Level I certification from the International Council for Machinery Lubrication (ICML).

Q:Are you planning to obtain additional training or achieve higher certifications?

A: I plan on obtaining my MLA Level II and III certifications in the future. It is my goal to have our oilers also earn Machine Lubrication Technician (MLT) Level I and II certifications.

Q:What’s a normal work day like for you?

A: Our team is made up of one oiler, one millwright and me. In the morning, we meet in the oil room and discuss the plans for the day. We talk about equipment permits, safety issues and the day’s work. I check any oil issues that may have been written up the night before and put them in the schedule according to priority. Any oil additions or breather changes would be done that day. Following the crew meeting, I check certain pieces of equipment that may have concerns. I also check the oil analysis reports and schedule work orders to remedy any problems. I research our equipment to find out what oils the manufacturer recommends. This will allow me to see if we can consolidate the oils. I also research breathers, filters and oil-related equipment so we can improve maintenance, make our jobs easier and extend the life of our equipment. We wrap up the day with a short meeting about what happened that day and what needs to be done the next day.

Q: What is the amount and range of equipment that you help service through lubrication/oil analysis tasks?

A: We are kept busy with sampling and monitoring our two turbine generator sets, 12 bowl mills, three large compressors, 12 large fans, 14 conveyor systems and a host of smaller equipment. We sample about 100 pieces of equipment. Depending on the equipment, these samples are taken in a range from once a month to once a year. We have another 175 gearboxes that are not sampled but are set up for regular oil changes.

Q: What lubrication-related projects are you currently working on?

A: Our team is now working on installing breathers. We are systematically changing our breathers over to an acceptable type. At the same time, we are moving the piping to a cleaner and more accessible spot. We will be setting up a preventive maintenance program for checking and replacing these breathers. On our major equipment gearboxes, we are piping in suction and discharge lines and adding quick couplers. We will locate these at convenient locations so that we can hook up our filter carts quickly and safely. This will eliminate the use of hoses that could be damaged or cause tripping hazards.

Q:What have been some of the biggest project successes in which you’ve played a part?

A: Our first big challenge was to clean 30 years of grease off the oil room floor, get rid of the barrels, replace them with totes, and then keep the room clean and neat. The oilers do not go home at quitting time until the oil room is cleaned up from the day’s work. This includes washing the floor every day at the end of the shift. The oil room must be as clean as or cleaner than it was in the morning. The oilers do this as part of their daily routine.

Q:How does your company view machinery lubrication in terms of importance and overall business strategy?

A: The SaskPower management team has supported our undertaking at PRPS. They feel that clean oil, oil analysis and vibration analysis will pay for itself over and over in the future. Just think of the satisfaction of knowing which equipment needs attention and which ones are going to fail. We can plan to repair equipment when we want to schedule it instead of when it breaks down in the middle of the night. It is hard to put a cost savings to this kind of reliability program. It can really cut down the financial burden of emergency repairs.

Q:What do you see as some of the more important trends taking place in the lubrication and oil analysis field?

A: I am very excited about the clean oil and oil analysis movement. It seems to me that the time is here. Companies are now realizing the benefit of these programs due to many major breakdowns and the unnecessary costs of plant downtime. Plant reliability is finally receiving the attention it deserves. At Poplar River, instead of ignoring the oil analysis data, we study it, take the findings and act on it before we run to fail. We now have more knowledge and support equipment than ever before. We are moving from the dark ages and starting to use the new technology that is available today.

Q:What has made your company decide to put more emphasis on machinery lubrication?

A: At Poplar River, this need for change became very apparent with far too many unnecessary equipment failures. The management team started to listen to the people on the floor. As tighter budgets and plant reliability became more important, we were left with no choice but to improve equipment reliability and develop a strong oil maintenance plan. This was the best way to achieve this at a reasonable cost. As our oil maintenance program expands, our plant will continue to reap more benefits that will in turn last for years to come.

Be Featured in the Next ‘Get to Know’ Section

Would you like to be featured in the next “Get to Know” section or know someone who should be profiled in an upcoming issue of Machinery Lubrication magazine? Nominate yourself or fellow lubrication professionals by emailing a photo and contact information to editor@noria.com..

Viewing all 154 articles
Browse latest View live