One of the primary functions of a lubricant is to preserve the cleanliness of a combustion engine’s mechanical parts. The cleanliness of these parts is facilitated by the introduction of detergency and dispersancy additives to the engine oil. This last property, dispersancy, is the property that allows the oil to suspend and carry away pollutants of diverse sources, such as soot from combustion, metallic particles from wear, corrosion of mechanical parts and insoluble products resulting from the aging of the oil, etc.
With the arrival of new fuels (e.g., biodiesel, ethanol blends, etc.), the existing or traditional lubricants present an important variability in terms of durability and resistance to pollutants. Studies show that the dispersancy capacity of certain types of lubricants is significantly degraded by the presence of specific pollutants, in particular fatty-acid methyl esters of biofuels, which have a significant impact.
![]()
Figure 1. Dispersancy tester instrument
It is therefore important to quantify the degradation of the oil in service (engines or transmission oils) and to monitor the evolution of the oil’s dispersancy properties during use to be able to determine steps and intervals for maintenance. Additionally, for the development of new lubricants, it is necessary to define a criterion of acceptance of the oil by its dispersancy capacity.
Existing Methods for Analyzing Lubricant Dispersancy
To date, no rigorous analytical method makes possible the measurement of the dispersancy capacity of the lubricant. The blotter spot method could provide an answer to this need, but the only method practiced to date is based on a visual evaluation. This subjective visual interpretation is not rigorous and consequently limits the information that could be provided by the method.
Engine Test
The objective of the engine test (DV4TD – CEC-L-93-04) is to evaluate the effect of combustion soot on engine oil viscosity increase and piston cleanliness. This procedure simulates high-speed highway service in a diesel-powered passenger car. The procedure fixture is an engine dynamometer procedure stand with a Peugeot DV4TD/L4 four-cylinder, in-line, common rail diesel engine installed. Pistons and rings are future rated for lacquer deposits and ring sticking. Kinematic viscosity at 100 degrees C, soot content and iron content in the used oil are evaluated at 24-hour intervals during the procedure. The final oil drain is used in conjunction with the intermediate samples to interpolate the absolute viscosity increase at 6 percent soot.
This approach has the merit of exactly reproducing the behavior of the lubricant under definite conditions of the test. However, the evaluation methods on the engine are very long and expensive. In addition, the precision of this test is not at the level of a laboratory method.
Blotter Test Method
Several versions of this old method exist in industry. Many studies show the value of this method as being rich in practical information on in-service lubricants, but it remains mainly manual and homemade. The interpretation of the blotter spot continues to be subjective and not formalized by a universally recognized method.
To conduct the test, a small quantity of a homogenized sample is heated to 240 degrees C (464 degrees F) for 5 minutes. The purpose of this short period of intense heating is to stress any oil that is close to thermal or oxidative failure so that the blotter spot shows a positive response. Any oil that is still in good shape will not be affected by such a short heating period, which will be reflected in the dispersion pattern of the blotter spot.
![]()
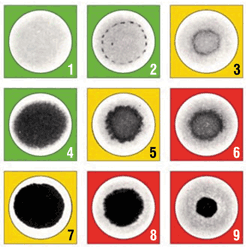
Figure 2. Lubricants at different levels of wear
Once the sample cools, an approximately 25-microliter aliquot is dropped onto chromatography paper (or filter paper) and allowed to spread or wick for 1 hour in an oven set at 80 degrees C (176 degrees F). The filter paper is then placed under a light source in order to locate the various rings. The calculation of a dispersancy index is provided by the measurement of the different sizes of the diffusion rings of the oil and the pollutants.
The current blotter test method by visual quotation remains subjective and not based on mathematical models. Although the blotter test offers limited value measuring soot concentration, it provides an excellent assessment of the lubricant’s dispersancy performance. An oil that is properly dispersing soot and other insolubles produces an evenly graduated blotter. A blotter indicating a high soot load but even graduation suggests that the oil is still fit for service but should be watched closely for degradation.
When dispersancy begins to fail, the insolubles start to form a dense ring on the exterior of the absorbing oil drop, as seen in spot 7 of Figure 2. Spot 9 indicates the characteristic dense black dot and shape periphery that forms when the oil completely loses dispersancy performance. From a maintenance perspective, when the ring begins to form around the exterior of the oil blotter, it is time to look at scheduling an oil change.
![]()
Figure 3. Oil spot preparation
Certain laboratories have established their own quotation method of the spot by a measurement of the diameter of certain halos (or rings) and calculations of diameter ratios. Because these methods are not published, it is almost impossible to compare the results obtained between various laboratories. Moreover, with the introduction of new oils and fuels (e.g., biodiesel, ethanol, etc.), the appearance of multiple rings caused by various pollutants (carbon particles, etc.) is noted. For these reasons, the visual/manual interpretation of the various rings is very complicated and not easily exploitable.
There exists an automated apparatus that facilitates the interpretation of the spot and eliminates the subjective aspect from the manual method. This instrument is equipped with a monochromic charge coupled device (CCD) camera and does not use the information color of the spot or differentiate each ring of the spot. The apparatus compares the diameter of the spot with a theoretical diameter and analyzes the opacity homogeneity of the spot. Of these two parameters, the device calculates a dispersancy index that varies from 0 to 100 (with 100 being the ideal dispersancy).
A New Approach
The goal of this new approach was not to reinvent the blotter test. A computer is used with dedicated software that was specifically developed for recognition and analysis of color images. With the digital imaging analysis of the spot, in particular its opacity and its spreading out by means of a dedicated algorithm and the choice of perfectly adapted filter paper, it becomes possible to evaluate in an objective and quantified way the residual power of a lubricant to disperse insoluble matter.
The general principle of the method for the preparation of the spot remains virtually unchanged. It consists of depositing a volume of 15 microliters of oil on a specific filter paper and analyzing the rings of the spot, which are representative of the dispersion of the pollutants. The sample volume was decreased from 20 microliters to 15 microliters to limit the size of the spot and to make it compatible with the image-analysis system, as well as to be able to analyze all types of lubricants.
The deposit of the oil on the filter paper is carried out at room temperature or in certain cases at 200 degrees C in order to free itself from the viscosity of the sample. The filter paper is then placed in a drying oven at 100 degrees C for 24 hours.
The instrument used for this new approach features a light source positioned above the measurement table (direct light) and a color CCD camera equipped with a high resolution. It also has dedicated software that is capable of monitoring both the light source and the camera. The software memorizes the numeric color picture of the spot.
This instrument makes it possible to take a digital color picture of the spot as the human eye sees it but with higher resolution. The image is memorized for the treatment and added to the test report, which enables you to visually check the results reported by the software. The use of a color camera allows you to identify the various rings by obtaining chromatic information on the spot.
In order to analyze the spot under the same conditions of lighting for optimized reproducibility, the calibration of the device is carried out on a white sheet of filter paper.
The software reports the following data:
-
The color image of the spot as the human eye perceives it.
-
The digital model in levels of gray associated with an opacity of the delimited ring by its real form.
-
The number of rings present in the spot, with ring 1 being the last external ring.
-
The diameter of each ring.
-
The surface of each ring.
-
The average opacity of each ring.
The software was designed to be able to analyze a series of spots coming from the same oil at various stages of degradation. This possibility was created in order to carry out a follow-up of each value measured during artificial life tests and also during the engine follow-up.
The new approach makes it possible to obtain results of dispersancy analysis in a numeric format. With this technique, the detection of the rings is much more precise and repeatable.
Case Study #1: Thermal Qualification of an Engine Oil
Before testing the new method on lubricants contaminated by biofuel, two lubricants considered internal references were tested.
-
RH 2010 engine oil was qualified as a high-level reference.
-
RL 2010 engine oil was qualified as a low-level reference (judged as “borderline”).
For the evaluation of the thermal behavior of engine oil, new and pure engine oil was stressed with an accelerated aging, including a thermal stress (170 degrees C) in the presence of oxygen and an oxidation proprietary catalyst. After 72, 96, 120 and 144 hours, samples were taken. Each sample was then analyzed with the new method and instrument described previously.
A spreading out of the high-level reference oil RH2010 in comparison to the borderline oil RL2010 was observed. In addition, it was noticed that opacities of the central rings were much darker. These tests carried out with the new blotter test method confirmed the respective quality level of the two engine oils. In this particular case, their capacity to disperse insoluble oxidation matter was verified.
Case Study #2: Thermal Qualification of an Engine Oil in the Presence of Biofuel
The same two qualified engine oils, the high-level reference and the borderline reference, were stressed with the aging method, but diesel B10 was added starting from 72 hours of the test. Then, the contamination level of diesel B10 was maintained to 10 percent during the remainder of the test.
A reduction in spreading out and a more important opacity in the presence of biofuel GOPSA10LUB for the high-level reference oil was observed. The RH2010 oil approached the rupture limit at the end of the 144 hours, but the total result according to the criteria remained satisfactory, although the bad dispersancy in the presence of biofuel was highlighted.
With this engine oil evaluated as borderline, a reduction in spreading out in the presence of biofuel GOPSA10 was observed. This result becomes critical with respect to the acceptable requirements that are based over the duration of 120 hours.
Conclusion
Although a relevant mathematical model must still be developed, this new method will make it possible to determine the dispersancy of an oil by its capacity to disperse insoluble matter. It also is able to precisely evaluate the resistance of a new oil to disperse insoluble matter when submitted to an oxidation test and/or thermal behavior test. In addition, it can determine the impact of pollutants such as biofuel on the dispersancy capacity of oils thanks to the precise measurement of each ring.
The process and the instrument of the new method are usable in the laboratory and on engine benches or rolling vehicles for any mechanical parts lubricated with oil, such as a marine engine or a wind turbine, and for many types of oils, including industrial oils, cutting oils, etc. Specific calculation criteria for oils resulting from rolling bench or in-service vehicles can also be defined.
By analyzing the measured parameters in each ring, it should be possible to determine the types of pollutants present in the oil and their implication on dispersancy. Thus, it becomes possible to have an indication on the cleanliness of the bodies and to quantify in a precise way the pollutants in oil (soot resulting from the combustion of the fuel, metal particles due to the wear and corrosion of the bodies, products resulting from the aging of oil, etc.).
.
![]()
 Fluitec recently introduced a new lubrication failure-mode diagnostic tool designed to provide a window into the health of lubricants. The RULER View is a technological advancement of Fluitec's flagship condition-monitoring product, the RULER, a patented technology to determine the remaining useful life of lubricants.
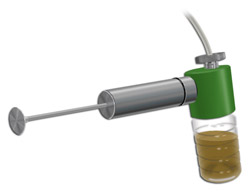
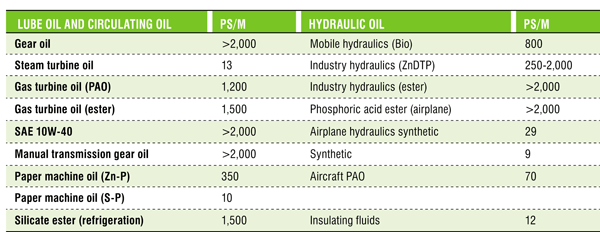
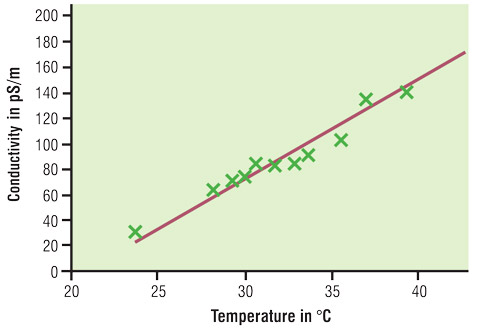
 “What temperature is best to measure the relative density of a lubricant in order to calculate its volume?”
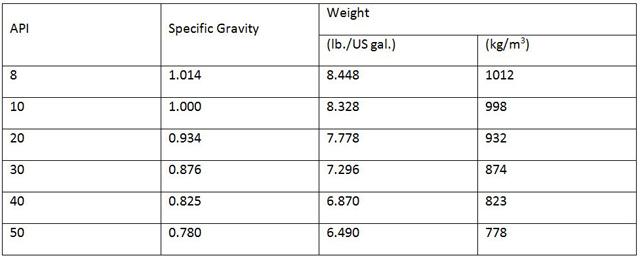
 "How do you check the quality of a lubricant additive? Which parameters are most important?"

 "A recent article suggested that particles that are removed from oil reduce failure detection via oil analysis. I use an oil centrifuge on my personal Cummins engine installed in a pickup, and I use oil analysis at oil change intervals. What would happen if I sent the residue to a lab to be analyzed after cleaning the 'stuff' out?"
 Universal Lubricants recently completed its 2 millionth Engine Guard oil analysis, a service milestone the company celebrated with long-time customer Hamm Inc., which submitted the 2 millionth engine oil sample for analysis. Universal Lubricants has provided this maintenance service to its commercial customers for more than 50 years.
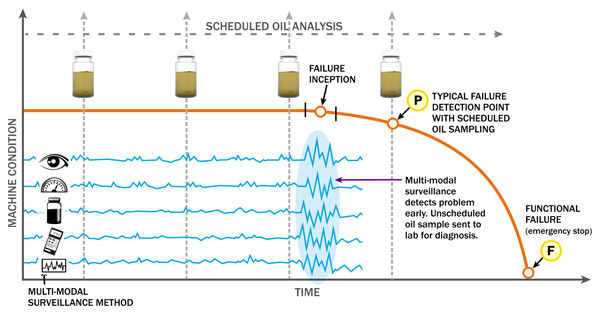
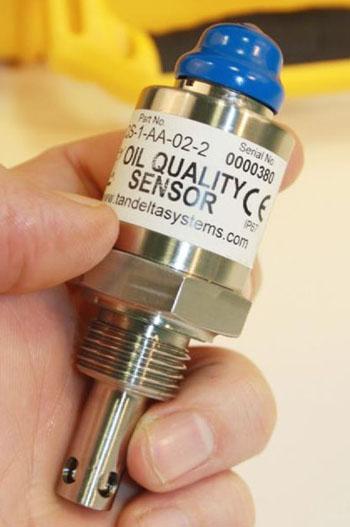 Tan Delta recently launched a new OQSx oil condition sensor that includes all of the company's available communication protocols in one device. Individual 4- to 20-milliamp (mA) signals for oil condition and temperature have also been added, making installation simple and straightforward.
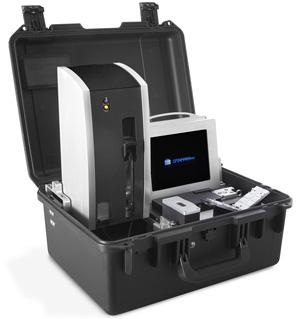 Spectro Inc. recently introduced a new portable fluid analysis system to give operators the capacity to perform comprehensive lubricant analysis in a wide variety of field environments. The Q5800 combines the ability to conduct abnormal wear metals analysis, particle counting, viscosity and lubricant condition as well as contamination tests in a compact, field-based system. The battery-powered device facilitates maintenance of equipment, enabling complete lubricant assessment for condition monitoring and fast results that permit informed maintenance decisions.